The Task Manager is a powerful Windows 11 utility that provides detailed real-time information about the software and hardware on your PC. It’s also indispensable when troubleshooting applications, monitoring hardware resource usage, and managing startup programs.
In this in-depth guide and overview, you’ll learn everything you need to know about the Task Manager in Windows 11, including ways to use it effectively.
Opening the Windows 11 Task Manager
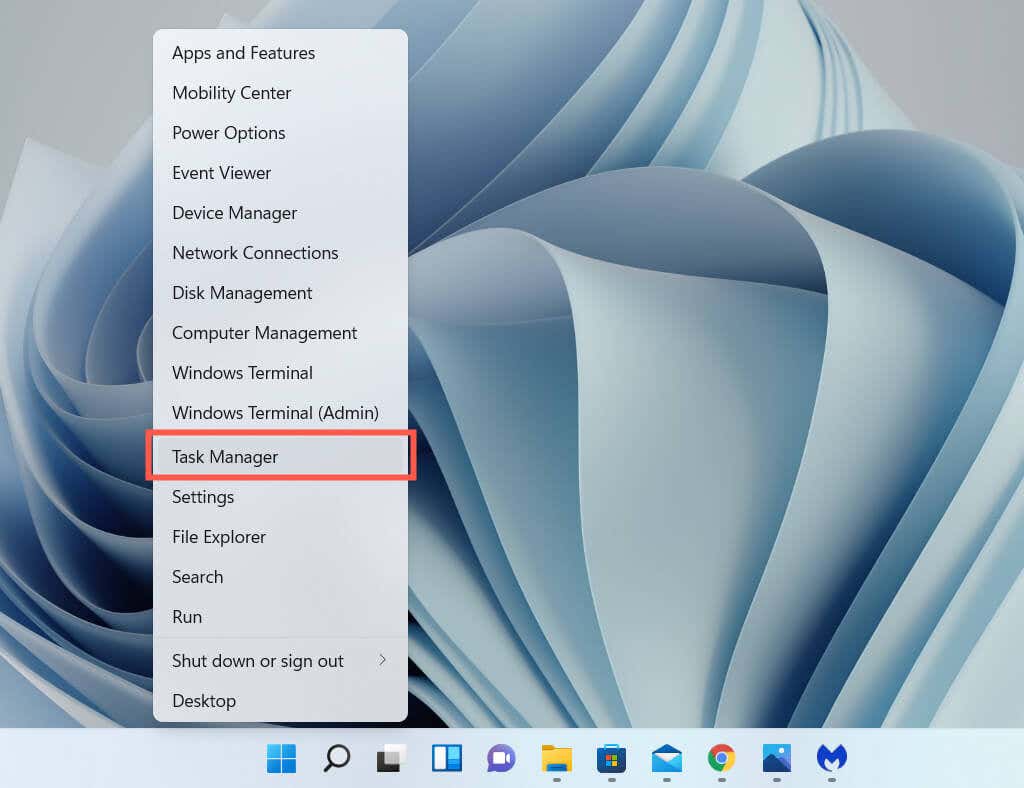
In Windows 11, you can launch the Task Manager just like any other program by selecting սկիզբ > Բոլոր ծրագրերը > Windows գործիքներ > Task Manager. However, the most convenient way to invoke it is through the Power User menu (right-click the սկիզբ կոճակը եւ ընտրեք Task Manager).
If you prefer keyboard shortcuts, pressing Ctrl + Հերթափոխություն + Esc will quickly bring up the Task Manager. If the operating system appears stuck, you can still get to it by pressing Ctrl + ալտ + ջնջել (which opens Windows 11’s Security Screen) and then selecting Task Manager.
The Default Task Manager
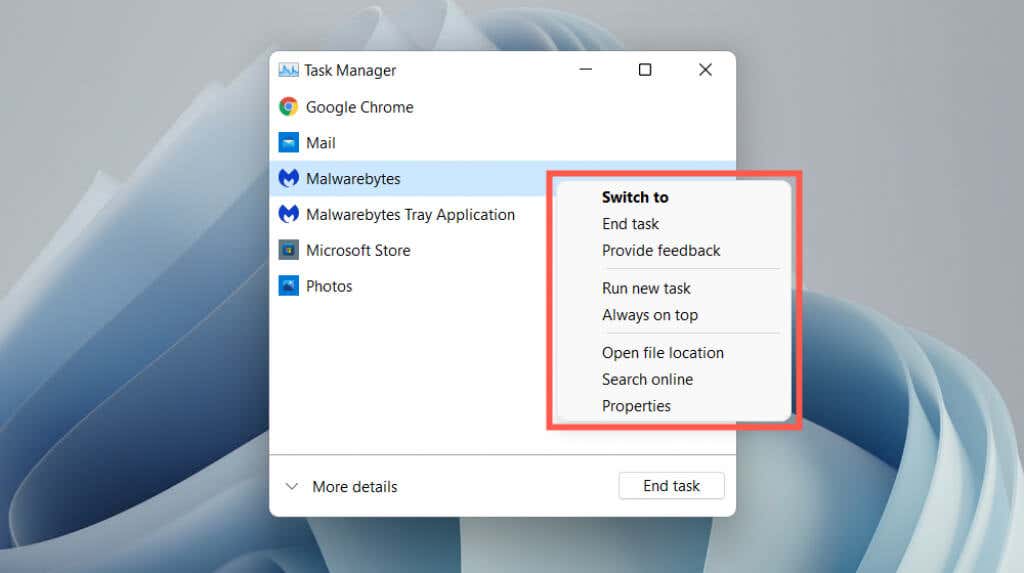
The Windows 11 Task Manager appears as a stripped-down version of the full user interface by default. It’s tiny, features no menu options, and simply shows a list of active apps on your computer.

You can choose any app within the list and forcibly shut it down by selecting the Վերջնական խնդիր button. That’s the quickest way to quit unresponsive programs.
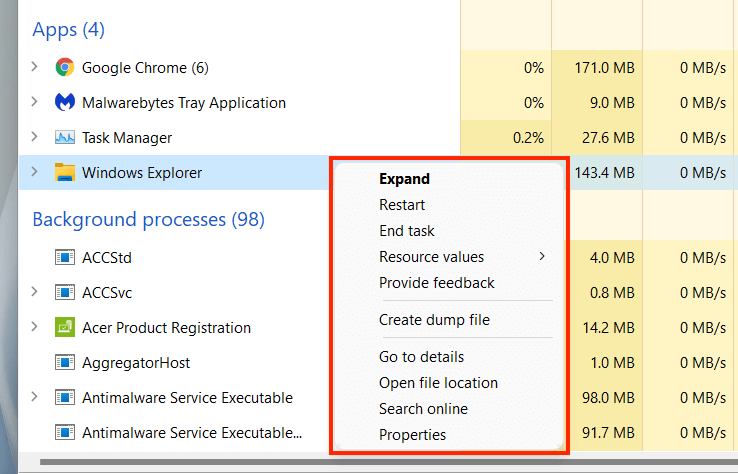
Right-clicking any app within the list also reveals multiple contextual options as follows:
- Անցնել: Immediately brings the app into focus.
- End task: Forcibly shuts down the app. It’s the same as selecting the Վերջնական խնդիր կոճակը:
- Տրամադրել հետադարձ կապ. Provide feedback to Microsoft.
- Ստեղծեք աղբանոց ֆայլ: Generate a dump (.DMP) file of the program, which is often requested by support engineers for troubleshooting purposes. You can also analyze dump files yourself.
- Run new task: Launch a new program, folder, or document with or without elevated privileges in Windows.
- Միշտ վերևում. Place the Task Manager on top of other apps. This option also works in expanded view, which then helps you track resource usage in real-time.
- Անցեք մանրամասներին: Automatically select the executable file related to the program within the Details tab in the expanded view.
- Open file location: Opens the directory of the program’s main executable file in a File Explorer window.
- Որոնել առցանց: Perform an online search using Bing. If you don’t recognize a program, use this option to learn more about it.
- Հատկություններ: Brings up the program executable’s Properties dialog box. You can then check or modify its general, compatibility, and security settings and view additional details such as the version, publisher, etc.
The Expanded Task Manager
Ընտրել Ավելի մանրամասն button at the bottom left corner to expand the Task Manager’s user interface. You can always select Fewer details to go back to the stripped-down version whenever you want.
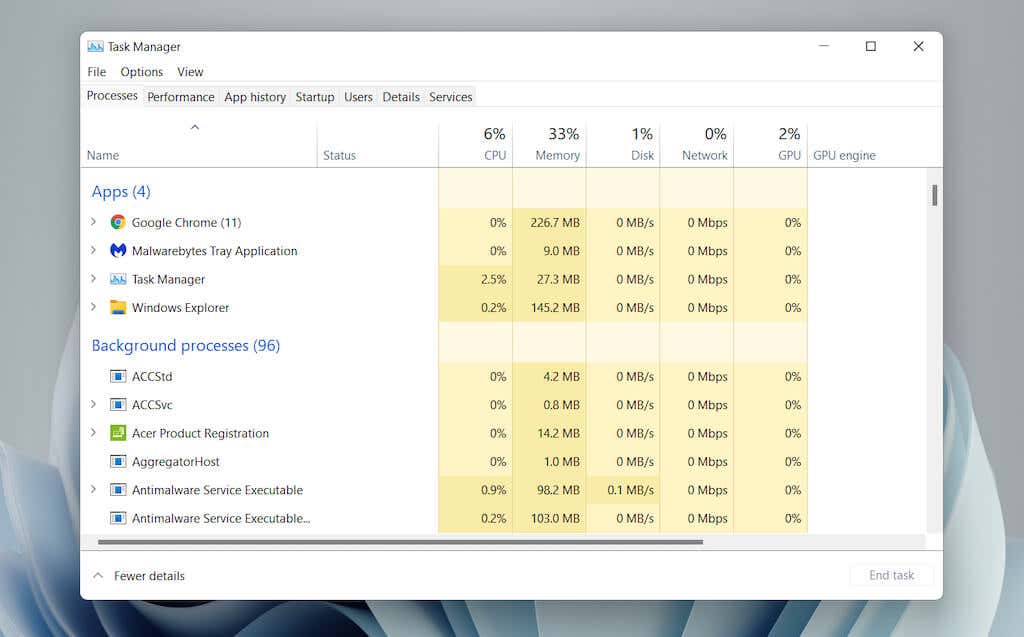
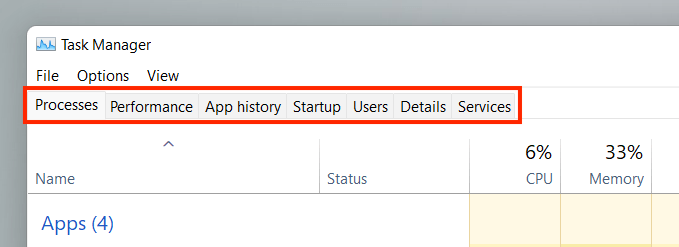
The expanded Task Manager consists of multiple tabs—Գործընթացները (կանխադրված), Performance, Հավելվածի պատմություն, Startup, Users, Մանրամասներ, եւ Ծառայություններ. You can change the default tab that appears when you open Task Manager by selecting Ընտրանքներ > Սահմանել լռելյայն ներդիրը ցանկի բարում:
Task Manager – Tab Overview
You’ll go through each tab in more detail below, but here’s a brief overview:
- Գործընթացներ. Offers a rundown of all active, background, and Windows processes on your computer, including performance stats per process.
- Performance. Provides real-time monitoring of the CPU (central processing unit), memory, storage drive, network adapter, and video card.
- App History: Displays the resource usage history of Microsoft Store apps (default view) and traditional programs (optional).
- Գործարկման: Lists programs that launch at startup and the related performance impact on your PC.
- Օգտվողներ: Displays the processes and resource usage on your computer for each user.
- Մանրամասներ: Provides a comprehensive list of processes and the relevant executable files in traditional format.
- Ծառայություններ Features native and third-party services, along with options to start, stop, and restart them.
Task Manager – Menu Options
In the expanded view, you’ll find a list of menu options to the top of the Task Manager—Ֆայլ, Ընտրանքներ, եւ Դիտել.
- Ֆայլ > Գործարկել նոր առաջադրանք: Open a program, folder, or document with or without administrative privileges.
- Ֆայլ > Ելք: Exit the Task Manager.
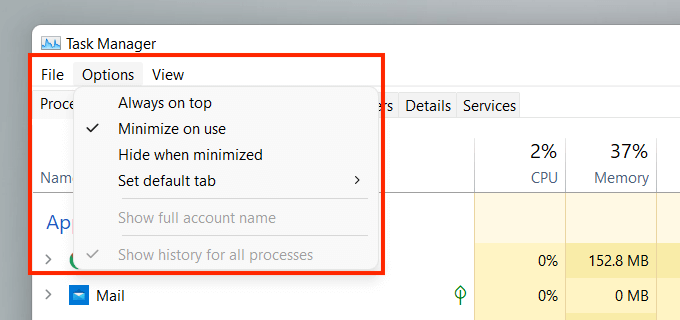
- Ընտրանքներ > Միշտ վերևում: Keep the Task Manager on top of other windows.
- Ընտրանքներ > Minimize on use: Hide the Task Manager while using the Պահել right-click option on an app or process.
- Ընտրանքներ > Hide when minimized: Hide the Task Manager in the system tray while minimizing it.
- Ընտրանքներ > Սահմանել լռելյայն ներդիրը: Change the default tab that you see each time you open the Task Manager.
- Ընտրանքներ > Show full account name: Display each user’s entire account name (profile and email ID) under the Users tab.
- Ընտրանքներ > Show history for all processes: Reveal the history for both Microsoft Store apps and non-Store apps under the App History tab.
- Դիտել > Refresh now: Immediately refresh all tabs within the Task Manager.
- Դիտել > Update speed: Determine the Task Manager’s refresh speed—Բարձր, սովորական (default), or Ցածր, Ընտրելով Դադար տվեց lets you stop all updates.
- Դիտել > Group by type: Group or ungroup processes under the Processes tab.
- Դիտել > Ընդլայնել բոլորին: Expand all processes to reveal sub-processes under the Processes tab.
- Դիտել > Ամբողջը քանդել: Collapse all expanded processes under the Processes tab.
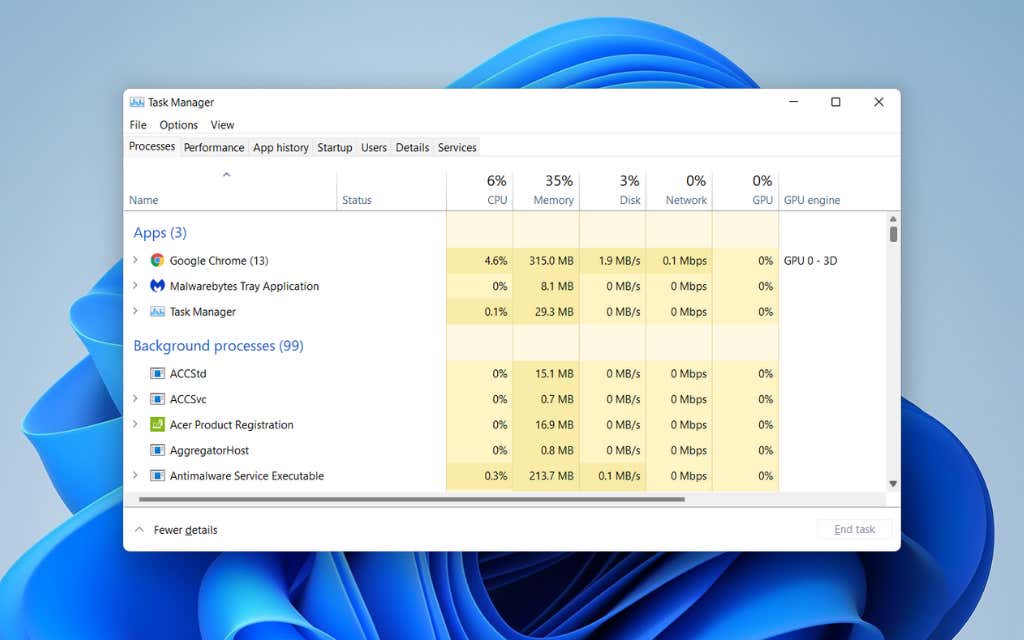
The Processes Tab
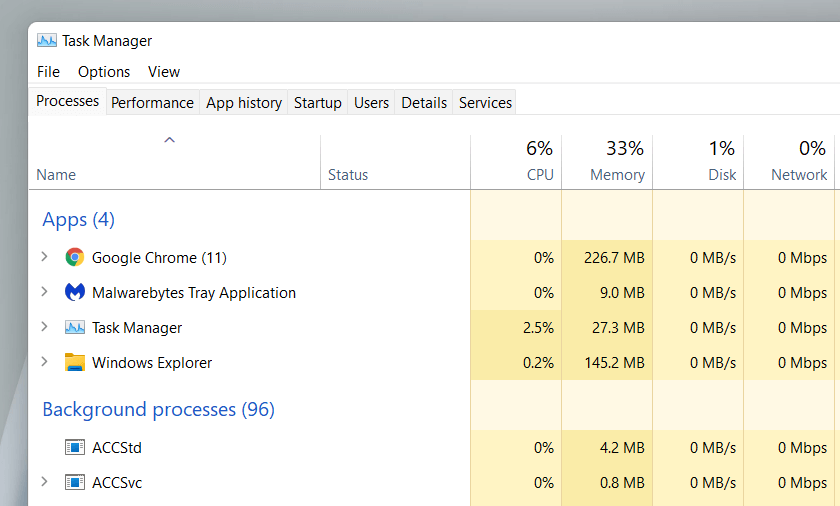
The Processes tab in the Windows 11 Task Manager features a list of live processes on your PC, along with real-time usage stats under separate columns.
Processes Tab – Name Column
The Apps section at the top of the Անուն column sports a list of all open programs in Windows 11. The Ֆոնային գործընթացներ section features apps that run in the background (e.g., the system tray). A third section—labeled Windows processes—lists processes related to the operating system.
If you want, you can merge the sections list by unchecking Դիտել > Group by type on the Task Manager menu. However, that makes it harder to locate specific apps and processes.
By default, the Task Manager groups and hides the sub-processes related to each program. To reveal them, simply double-click a program’s name or select the tiny arrow icon next to it.
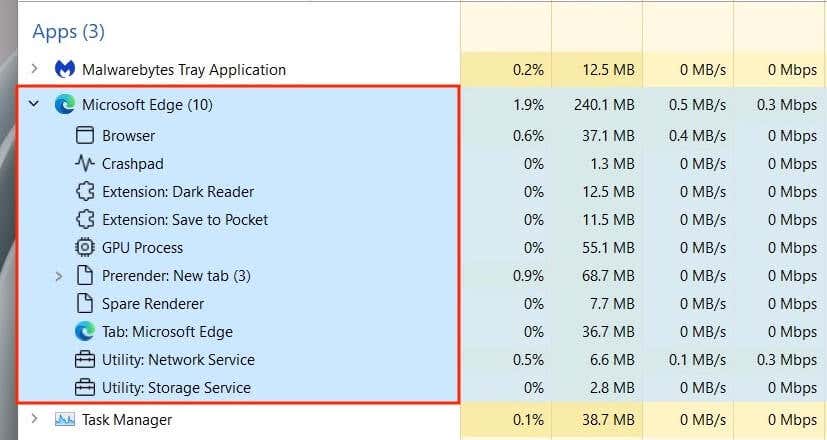
Optionally, use the Դիտել > Ընդլայնել բոլորին և Ամբողջը քանդել menu options to expand and collapse all sub-processes under the Processes tab.
Right-clicking a process reveals multiple options, similar to what you get in the Task Manager’s simplified view. An exception is the integral Windows Explorer process, which features a Վերսկսել տարբերակ փոխարեն Վերջնական խնդիր. That allows you to troubleshoot File Explorer-related issues by restarting it.
Processes Tab – Other Columns
The Processes tab contains additional columns that provide real-time system resource usage stats and insights for each process and subprocess, along with colors that shift between yellow and red to indicate minor to heavy resource usage.
The CPU, Հիշողություն, եւ Սկավառակ columns are arguably the most important since they let you spot programs that consume lots of resources. Selecting a column enables you to sort processes from the most resource-intensive to the least and vice-versa. This can be useful, for example, in figuring out things like which apps are causing the most CPU or Disk activity.
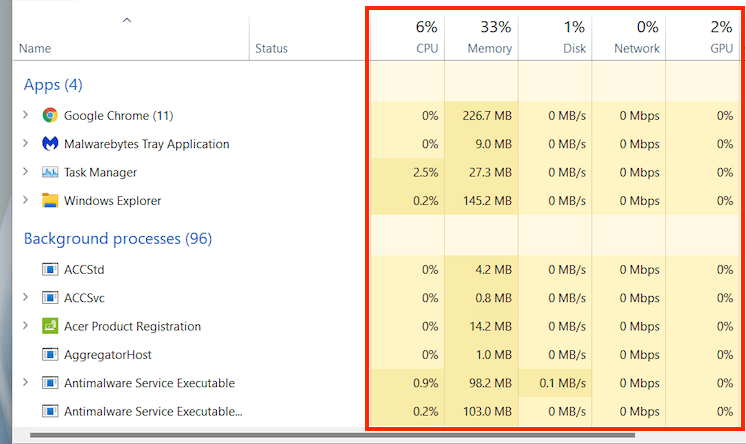
- Կարգավիճակ: Displays a leaf-shaped icon to denote if Windows 11 has suspended the process to conserve power.
- CPU: Current CPU resource consumption of each process in percentage terms. An aggregate value is listed at the top of the column.
- Հիշողությունը Current memory usage in megabytes for each process, along with the total amount as a percentage at the top.
- Disk: Disk usage for each process.
- Ցանց: Live network activity of each process in մեգաբիթ վայրկյանում.
Processes Tab – Additional Columns
Right-clicking any column also gives you the option to activate additional columns:
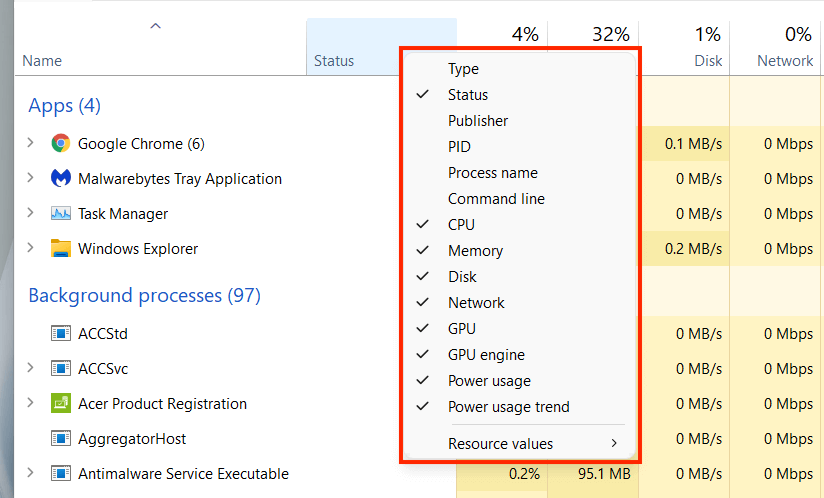
- Տիպ: Displays the process category—Հավելվածը, Ֆոնային գործընթացԿամ Windows process.
- Հրատարակչություն: Reveals the publisher of the related program or service—e.g., Microsoft.
- PID: Unique decimal number assigned to each process, helpful in distinguishing between multiple instances of the same program.
- Գործընթացի անվանումը. This shows the filename and extension of the process.
- Հրամանի տող. Displays the full command line, options, and variables related to the process.
- GPU: GPU activity in percentage terms for each process.
- GPU Engine: Displays the GPU engine in active use by the process—3D, Տեսանյութ Վերծանել, Video մշակմանԵւ այլն:
- Էլեկտրաէներգիայի օգտագործում. Power consumption of a process on a scale of Շատ ցածր, Ցածր, Չափավորի, Բարձր, եւ Շատ բարձր ցանկացած պահի.
- Power Usage Trend: Power usage of a process as an average. This is a better indicator since it accounts for time.
- Ռեսուրսների արժեքները: This lets you change the Հիշողություն, Սկավառակ, եւ Ցանց columns to display values instead of percentages.
The Performance Tab
The Performance tab in the Task Manager lets you monitor total real-time utilization of the CPU, memory, disk, network, and GPU in Windows 11. Select each hardware component on the sidebar to view the relevant information.
Performance Tab – CPU
ցուցադրում Պրոցեսորի օգտագործումը by all processes over 60 seconds on a scale of 0-100. On multi-core CPUs, right-click the graph and select Գրաֆիկը փոխել > Logical processors to display separate charts for each logical processor. Hovering your cursor over a processor will reveal if the operating system has “parked” it to conserve power.
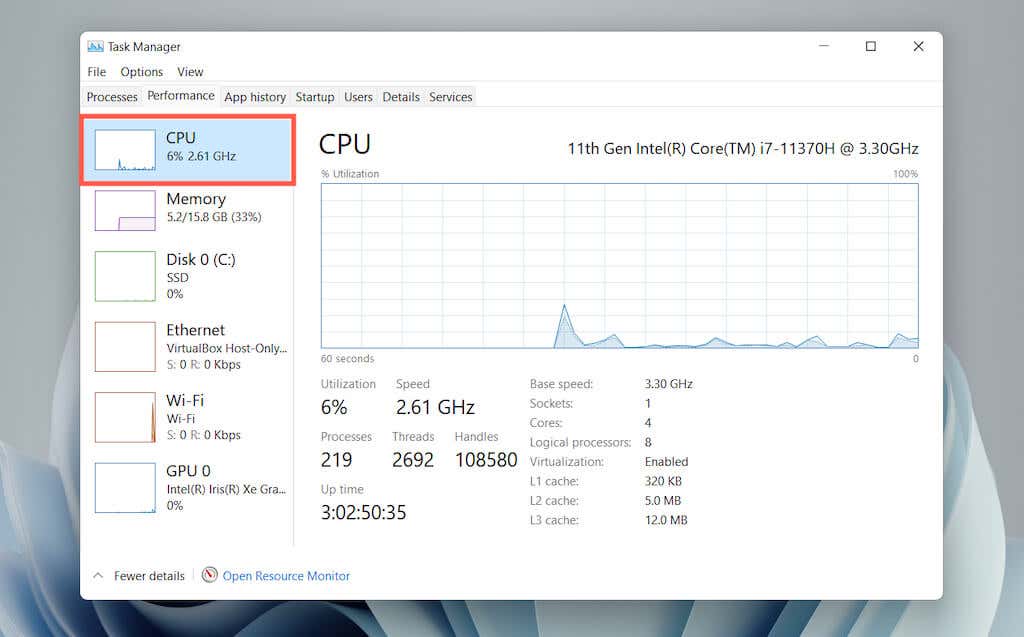
Underneath the graph, you’ll find the following information:
- Օգտագործումը: CPU utilization as a percentage.
- Արագություն: Current speed of the CPU.
- Գործընթացները: Total number of processes handled by the CPU.
- Թեմաներ: Thread count for all processes handled by the CPU.
- Բռնակներ: Total number of associations with shared resources (files, programs, memory locations, etc.).
- Up ժամանակ: Time since you last turned on your PC.
The rest consists of general information related to the CPU, such as the processor model, base speed, and virtualization status.
Performance Tab – Memory
Displays total RAM usage in graphical format over 60 seconds on a scale of 0-100. In addition, a separate graph labeled Հիշողության կազմը reveals a snapshot of the memory consisting of the following in different shades of color:
- Օգտագործման մեջ: Memory in active use by processes, drivers, and the operating system.
- Փոփոխված: Memory that must be written to the disk before it can be repurposed.
- Կանգնած: Memory consisting of cached data not in active use.
- ազատ: Memory that’s immediately available for use.
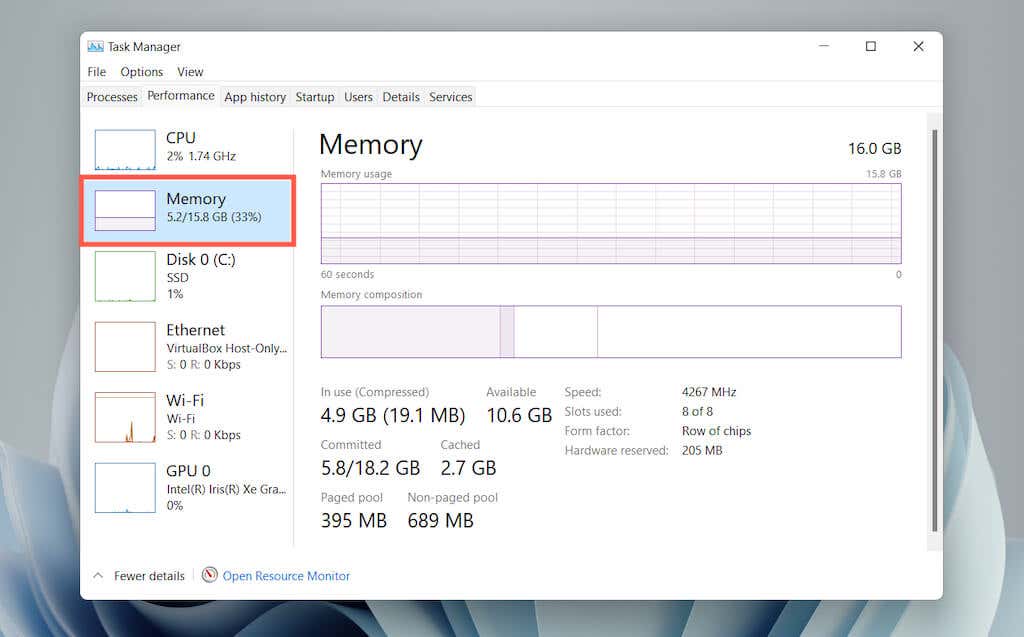
Underneath both graphs, you’ll see the following information as numeric values:
- Օգտագործման մեջ: The amount of memory actively used by processes, drivers, and the operating system.
- Մատչելի: Memory available for use by the operating system (the sum of the Հենարան և ազատ categories in the memory composition graph).
- Կատարվել: Displays a couple of values related to the page file in Windows.
- Պահված է: The sum of the Փոփոխված և Հենարան categories in the memory composition graph.
- Էջի լողավազան: Kernel and device driver memory that can be moved from RAM to the page file.
- Ոչ էջավորված լողավազան: Kernel and device driver memory that must stay in RAM.
The rest is general information about the physical memory modules—speed, the number of RAM slots used, and the form factor.
Performance Tab – Disk
Depending on the number of partitions and removable drives on your PC, you may see multiple disks listed under the sidebar. Each consists of two graphs that display disk utilization over 60 seconds on a scale of 0-100.
The Ակտիվ ժամանակ graph reveals the read and write requests, while the Disk transfer rate graph displays transfer rates between the drive and the operating system.

In addition to general drive-related information such as capacity, model, and type (HDD or SSD), you’ll see the following information:
- Ակտիվ ժամանակ: Percentage of time the disk spends reading or writing data. Higher percentages may indicate bottlenecks (often the case with mechanical hard drives).
- Արձագանքի միջին ժամանակը: Average amount of time to complete read and write requests.
- Կարդալ արագություն: The disk drive’s current read speed in kilobytes per second.
- Գրեք արագությունը: Current write speed of the disk drive in kilobytes per second.
Performance Tab – Wi-Fi/Ethernet
Reveals network information such as the adapter name, SSID, connection type, send and receive speeds (in Kbps), IPv4 and IPv6 addresses, and signal strength.
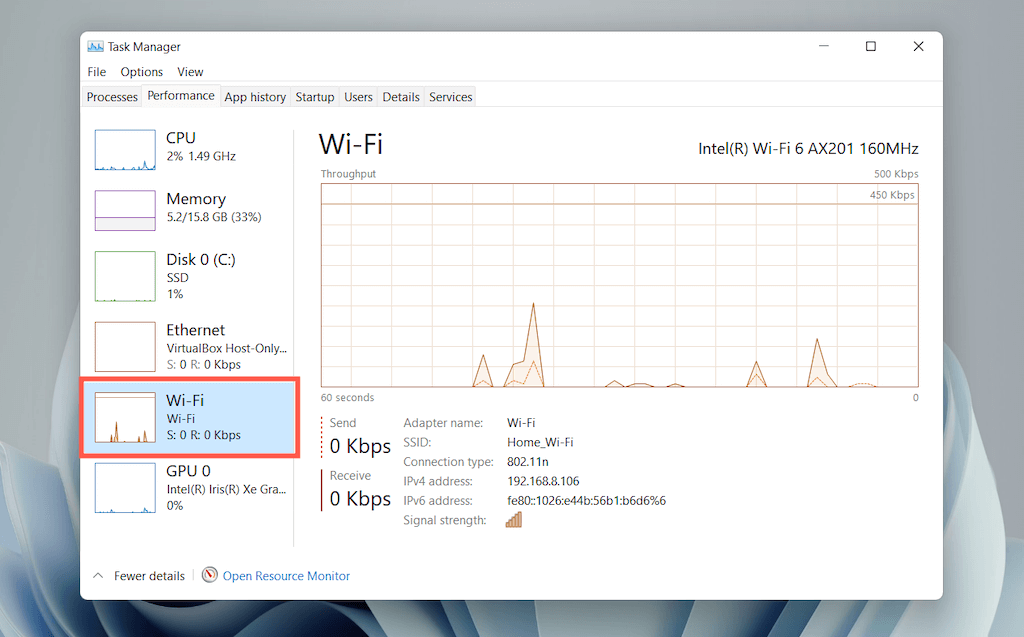
The graph displays total network utilization by apps and the operating system. Right-clicking the chart and selecting View network details will reveal extra information regarding network activity.
Performance Tab – GPU
Displays the GPU model, utilization, and other information regarding your PC’s video card, such as the amount of dedicated or shared memory and driver version. However, this section may not show up on computers with integrated graphics.
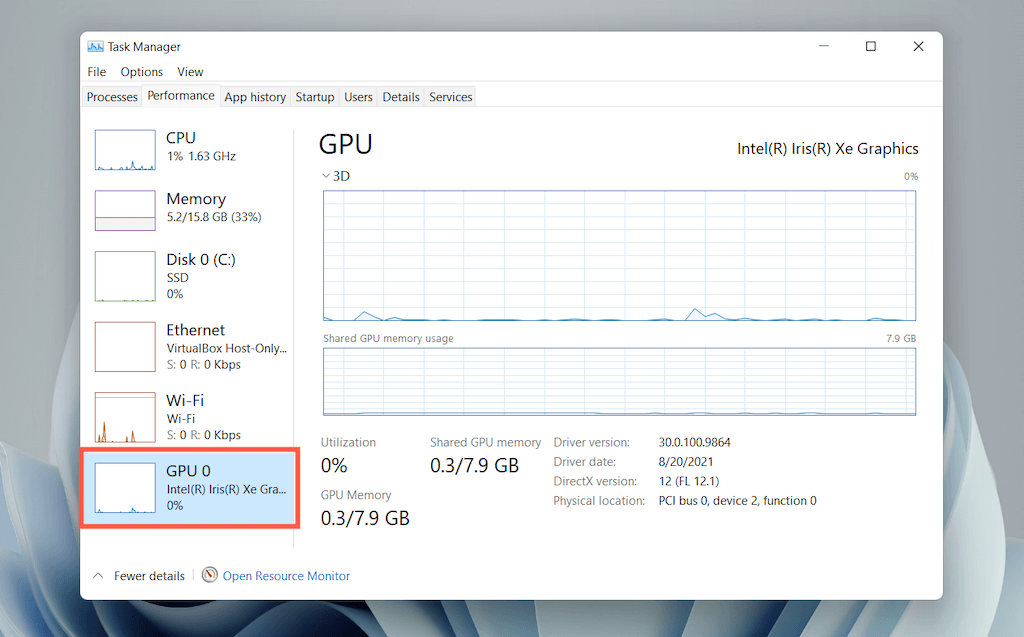
You can switch the default graph to display activity by GPU engine (3D, Video Վերծանման, Video մշակման, etc.) by right-clicking and selecting Գրաֆիկը փոխել > Multiple engines.
Նշում: Windows 11 also includes an advanced hardware monitoring utility dubbed the Resource Monitor. Select Բացել ռեսուրսների մոնիտորը at the bottom of the Performance tab to get to it.
The App History Tab
The Task Manager’s App History tab displays the total CPU and network usage stats for Microsoft Store apps. If you want, you can include non-Store apps within the list by selecting Ընտրանքներ > Show history for all processes ցանկի բարում:
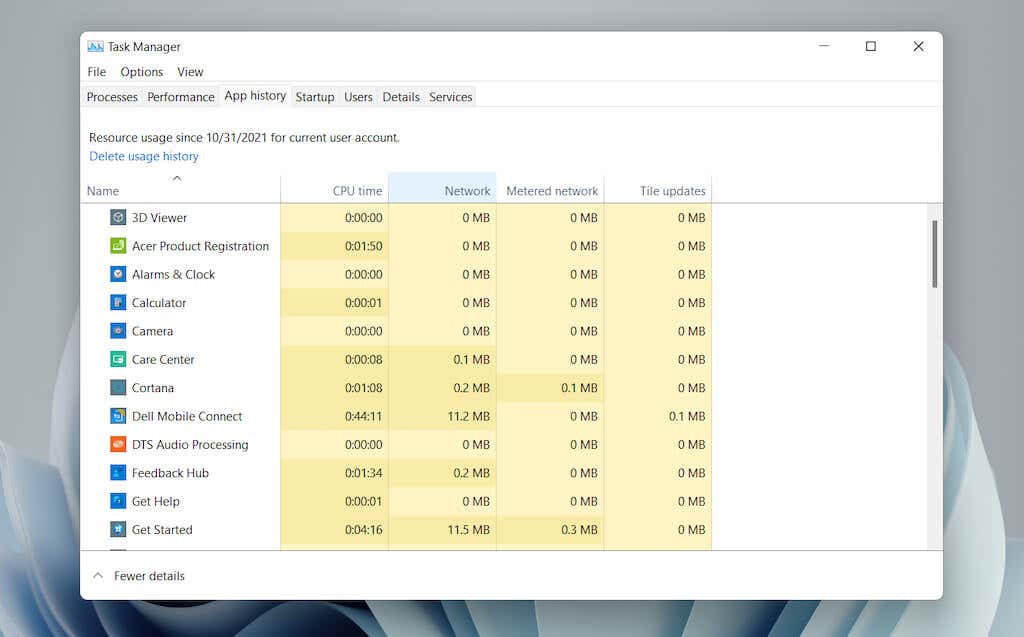
You can reset the count for all columns by selecting Delete usage history էկրանին վերեւում:
App History Tab – Default Columns
The App History tab displays the following columns:
- Անունը: The name of the program.
- CPU time: The total time the program has utilized the CPU since the last reset.
- Ցանց: The total bandwidth (in megabytes) consumed by the program.
- Metered network: The total amount of data the program has consumed on metered networks.
- Tile updates: Data consumption related to live tile updates in the Start menu. This option is irrelevant since live tiles aren’t present in Windows 11. However, you may still see activity in the column with older apps that attempt to trigger updates in the background.
App History Tab – Additional Columns
Optionally, you can right-click any of the existing columns to activate the following columns:
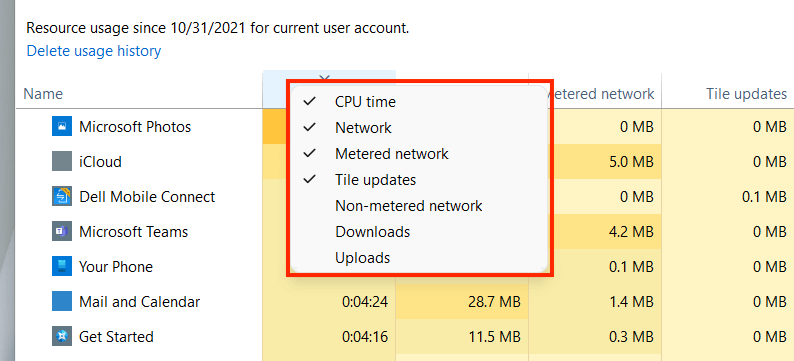
- Non-metered Network: Total data usage on non-metered networks.
- Բեռնումներ: Overall data usage related to downloads performed by apps.
- Վերբեռնումներ ՝ Overall data usage related to uploads performed by apps.
App History Tab – Contextual Options
Right-clicking an app reveals the following options:
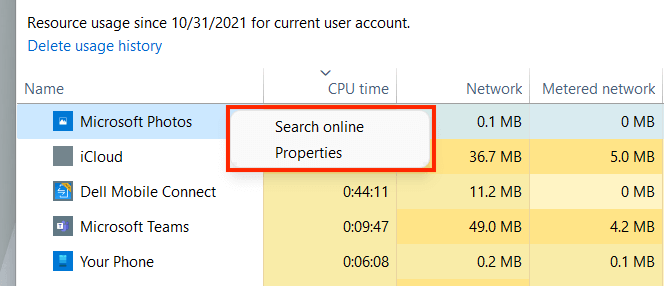
- Որոնել առցանց: If an app appears unfamiliar, select this option to perform a cursory check online.
- Հատկություններ: Open the Properties pane of the app’s main executable file.
The Startup Tab
The Startup tab in the Task Manager lists every app that loads at computer startup. Since multiple start programs can adversely impact the operating system’s performance, you can use this tab to manage them.
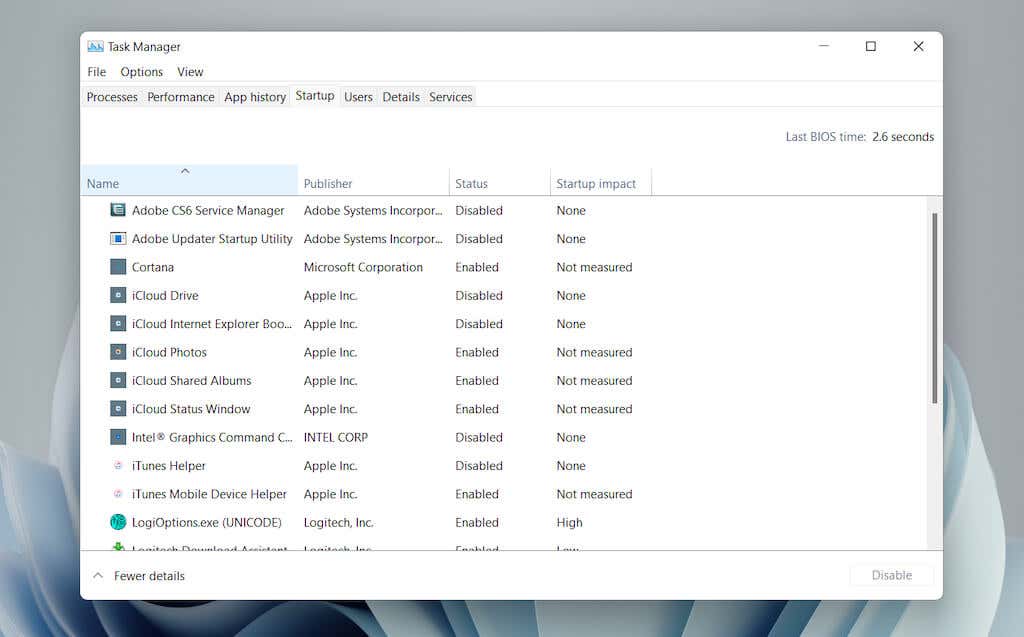
Startup Tab – Default Columns
The startup tab lists the following columns:
- Անունը: The name of the startup program.
- Հրատարակչություն: The program’s publisher.
- Կարգավիճակ: The program’s status (Միացված or Անաշխատունակ).
- Startup Impact: The startup impact of the program (Low, Normal, High, or Very High).
Startup Tab – Contextual Options
Right-clicking an app reveals the following options:
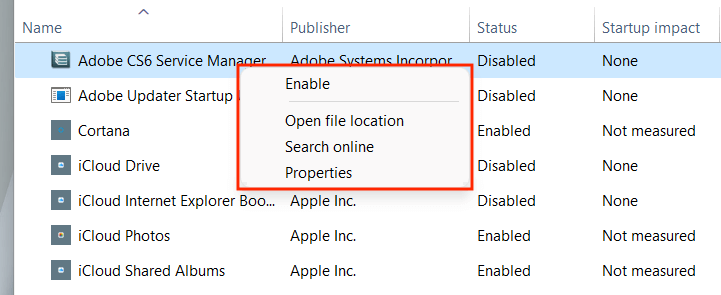
- Թույլատրել/Խեղել: Enable or disable the startup program.
- Open file location: Opens the program’s executable file in a File Explorer window.
- Որոնել առցանց: Perform a search of the program online.
- ՀատկություններԲացել Հատկություններ pane of the program’s executable file.
Startup Tab – Additional Columns
You can also right-click an existing column to activate any of the following columns:
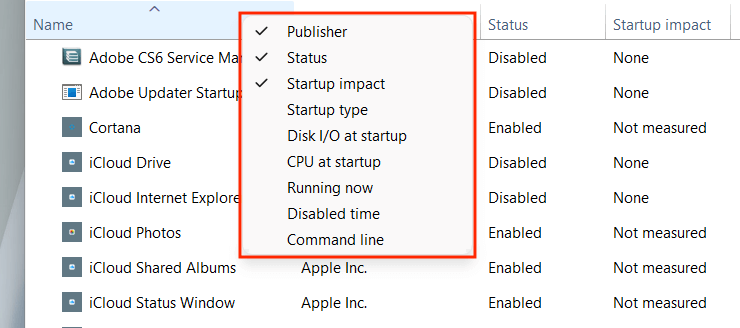
- Գործարկման տեսակը. The startup source of the program (the system registry or the Startup folder in Windows).
- Disk I/O at startup: The amount of disk activity in megabytes related to the process at startup.
- CPU at startup: The impact on CPU usage at startup.
- Running now: Reveals if the program is running at the moment or not.
- Disabled time: The time since you last disabled the program.
- Հրամանի տող. Displays the program’s command line path, including any options and variables related to it.
The Users Tab
The Users tab in the Task Manager displays a list of all users on your computer. It’s similar to the Processes tab, except that you can view resource usage by user.
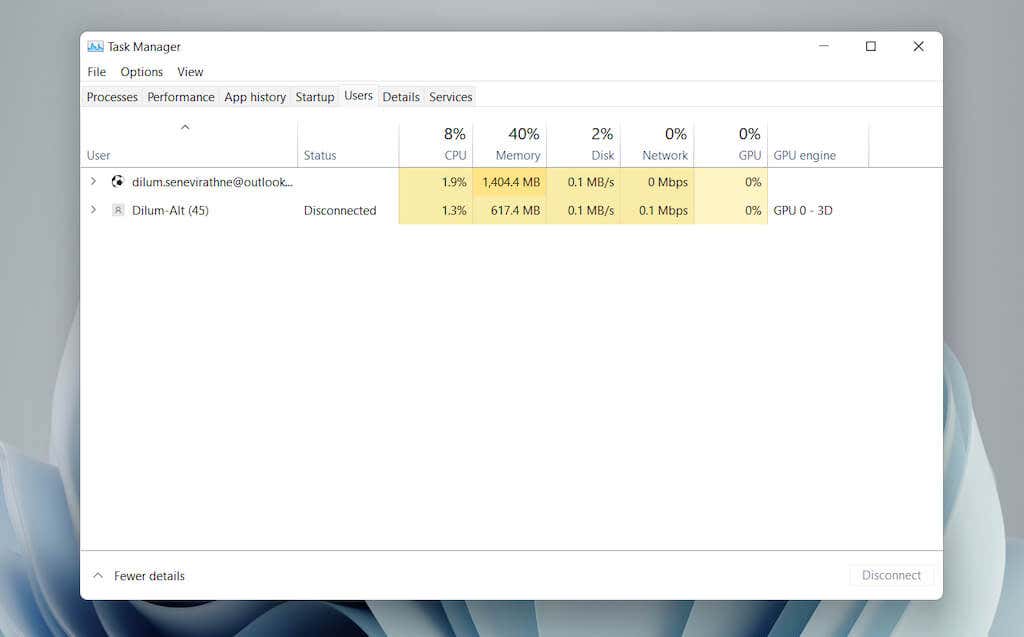
Users Tab – Default Columns
You can find the following columns within the tab:
- Օգտվող: Lists the names of signed-in users. Double-click a name to reveal all processes related to the user.
- Ստատուս: Displays the status of each process for a user, including if the processes are suspended or not.
The CPU, Հիշողություն, Սկավառակ, Ցանց, GPU, եւ GPU շարժիչ are essentially the same compared to what you see on the Processes tab.
Users Tab – Additional Columns
Right-clicking an existing column allows you to activate additional columns:
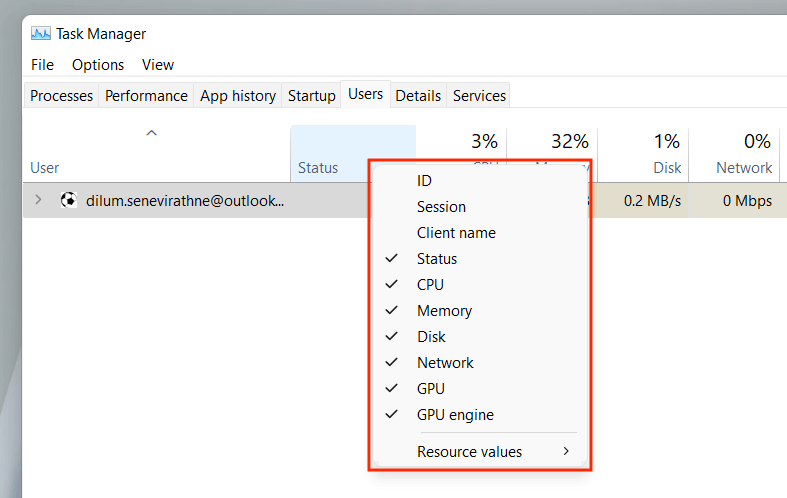
- ID: The user’s ID.
- Սեմինար. The session duration of the user.
- Հաճախորդի անունը. The user’s hostname (if the user connects to your PC via a remote connection).
Users Tab – Contextual Options
Right-clicking a user reveals the following contextual actions:
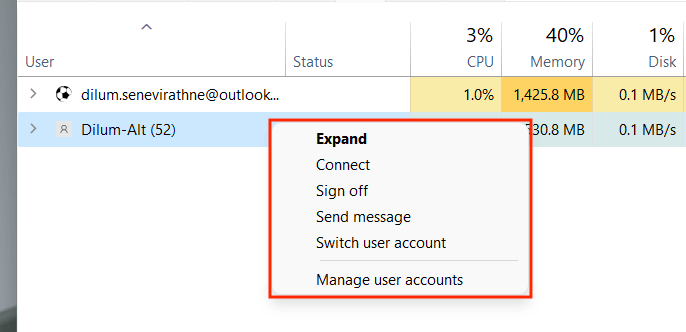
- Ընդարձակել: Reveal processes related to the user account.
- միացնել: Switch to the user account by inserting its password.
- Դուրս գալ: Forcibly signs off the user and may result in data loss.
- Ուղարկել հաղորդագրություն: Send a message to the user. Enter a title and message and select OK.
- Switch user account: Switch to the user account.
- Կառավարեք օգտվողի հաշիվը: Opens the Օգտագործողի հաշիվները էկրանին Control Panel.
The Details Tab
The Details tab offers an expanded view of all processes on your computer, including those from other user accounts. It’s similar to the Processes tab from the Task Manager in Windows 7 and earlier.
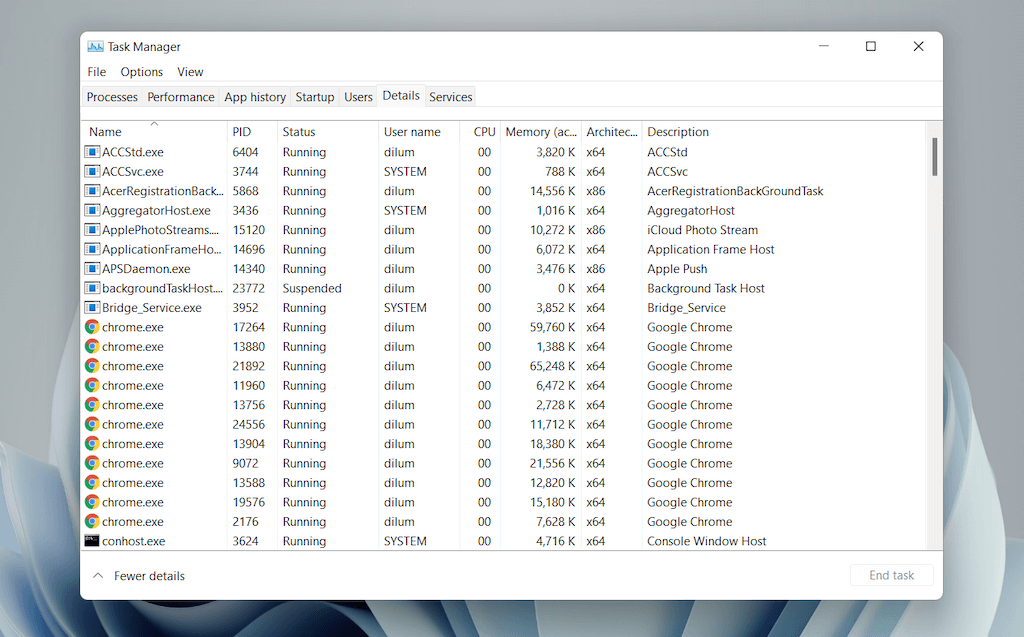
Details Tab – Default Columns
The Details tab is broken down into the following columns:
- Անուն: Name of the process.
- PID: Unique number assigned to each process.
- Ստատուս: Status of the process—Վազում or Կասեցվել է.
- Աբոնենտի անունը: What initiated the process—you, another user, the operating system, etc.
- CPU: CPU activity related to the process.
- Հիշողություն: The amount of memory used in kilobytes.
- ճարտարապետություն: Architecture of the process – 32 կամ 64 բիթ.
You can also activate a host of additional columns by right-clicking an existing column and selecting Enable additional columns. However, these are highly technical and best suited for power users, so we won’t go over them here.
Details Tab – Contextual Options
Right-clicking a process reveals the following options:
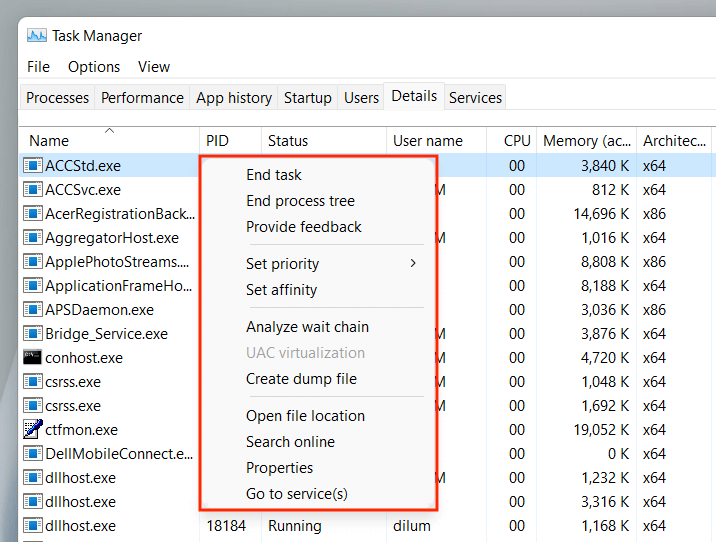
- End task: Forcibly shut down the process.
- End process tree: End the entire process tree related to the process. This is similar to ending a group of processes in the Processes tab.
- Սահմանել առաջնահերթություն: Determine the priority given by the CPU to the process compared to others. Options include Իրական ժամանակ, Բարձր, Նորմալից բարձր, սովորական, Below Normal, եւ Ցածր.
- Set affinity: Specify the CPU core or cores used by the process.
- Analyze wait chain: Identify and end other processes that the process is using or waiting to use.
- UAC virtualization: Change the UAC virtualization status. If enabled, it allows processes to write into a virtualized location instead of areas where they don’t have permissions. That could improve compatibility with legacy apps.
- Create dump file: Create a memory dump for troubleshooting purposes.
- Open file location: Open the executable file’s location.
- Որոնել առցանց: Search online for more details about the process or task.
- Հատկություններ: Access the executable file’s Properties pane.
- Go to services: Highlight related services within the Services tab.
The Services Tab
The Services tab details every native and third-party service on your PC, such as those related to Windows Update, Bluetooth, the Տպել Spooler- ը, etc. It lets you start, stop, and restart services.
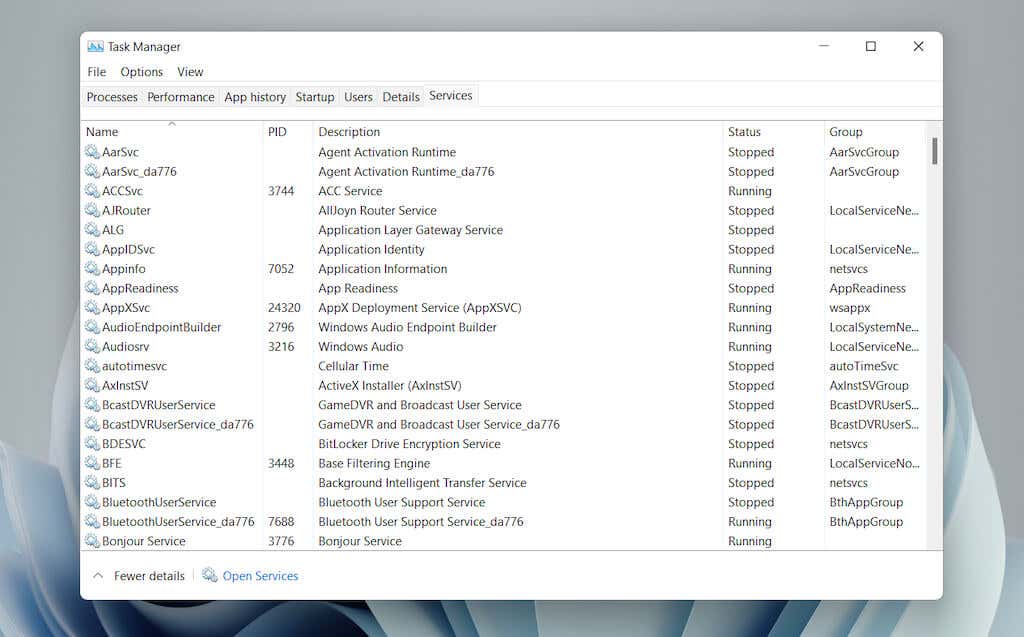
Services Tab – Default Columns
The services pane consists of the following columns:
- Անուն: Name of the service.
- PID: Process ID of the service (helpful in identifying the service-related process).
- Նկարագրություն: Brief description of each service.
- Ստատուս: Status of the process (Վազում or Դադարեցրեց). Some processes may show up as Սկսելով if they appear to be stuck.
- խումբ: Reveals any related group that a service is a part of.
Services Tab – Contextual Options
Right-clicking a service will reveal the following contextual options:
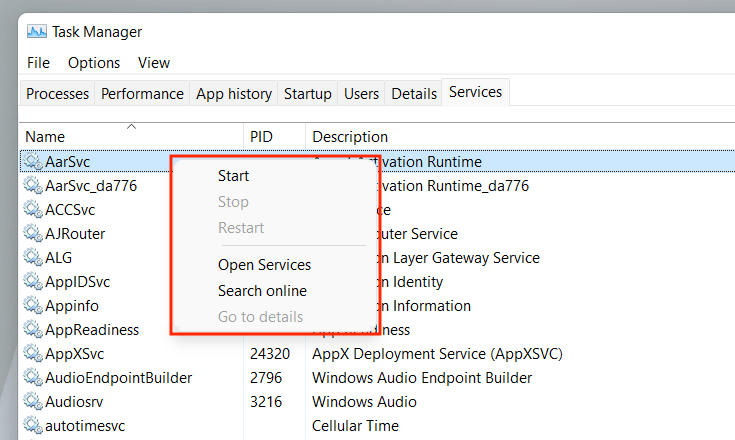
- սկիզբ: Start the service.
- Քայլ: Stop the service.
- Վերսկսել: Restart the service.
- Բաց ծառայություններ: Opens the Services applet (a utility that provides configuration options for each service).
- Որոնել առցանց: Search online for details about the service.
- Անցեք մանրամասներին: Switches to the Details tab and highlights the relevant executable (useful for troubleshooting).
Put the Task Manager to Good Use
The Task Manager in Windows 11 is instrumental in identifying how your PC’s various programs and hardware work. Despite being filled with lots of information and options, however, getting a brief understanding of what it takes to shut down troublesome apps and manage resource-heavy processes alone can positively impact day-to-day usage.
 Dark Mode in Windows 11")
