What is Performance Monitor? Many times it occurs that our computer just ceases to respond, shuts down unexpectedly or behaves abnormally. There could be a number of reasons for such behavior and pointing out the exact reason could be of great help. Windows has a tool named Performance Monitor, which you can use for this purpose. With this tool, you can keep a check on the performance of your system and identify how different programs affect the system performance. You can analyze data related to your processor, memory, network, hard drive, etc. It can tell you how the system resources are managed and other configuration information that might be useful for you. It can also collect and log the data in files, which can be analyzed later. Read on to see how you can use Performance Monitor to fix performance related issues in Windows 10.

How to open Performance Monitor
You can use Performance Monitor on Windows 10 to analyze data and keep a check on the performance of your system, but first, you must know how to open this tool. There are many ways to open the Windows Performance Monitor, let’s see a few of them:
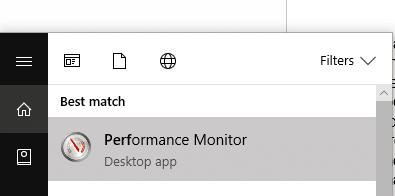
- Kiểu "Giám sát hiệu suất” in the search field located on your taskbar.
- Click vào Performance Monitor phím tắt để mở nó.
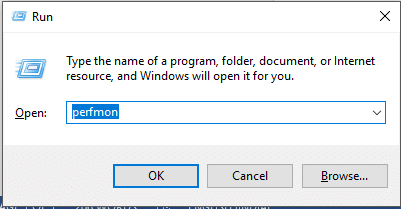
To open Performance Monitor using Run,
- Nhấn phím Windows + R để mở Run.
- Kiểu perfmon và bấm vào OK.
To open Performance Monitor using Control Panel,
- Use the search field on your taskbar to open the Bảng điều khiển.
- Bấm vào 'Hệ thống và bảo mật'sau đó nhấp vào'Công cụ quản trị'.
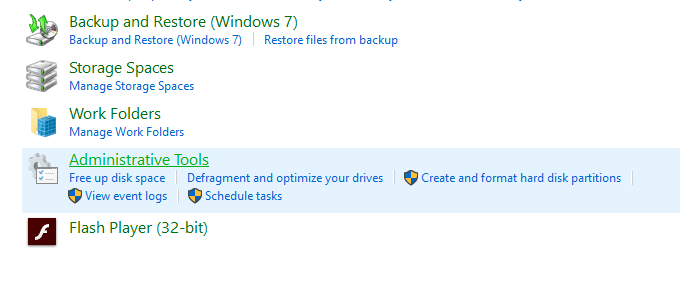
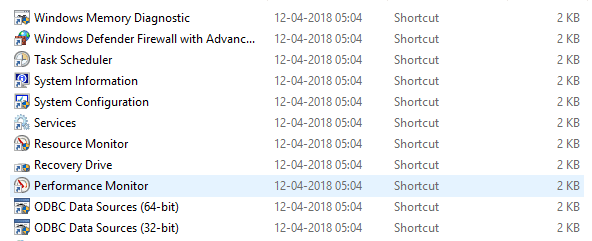
- In the new window, click on ‘Performance Monitor'.
How to Use Performance Monitor in Windows 10
Đảm bảo tạo điểm khôi phục đề phòng trường hợp xảy ra sự cố.
When you first open Performance Monitor, you will see the overview and system summary.
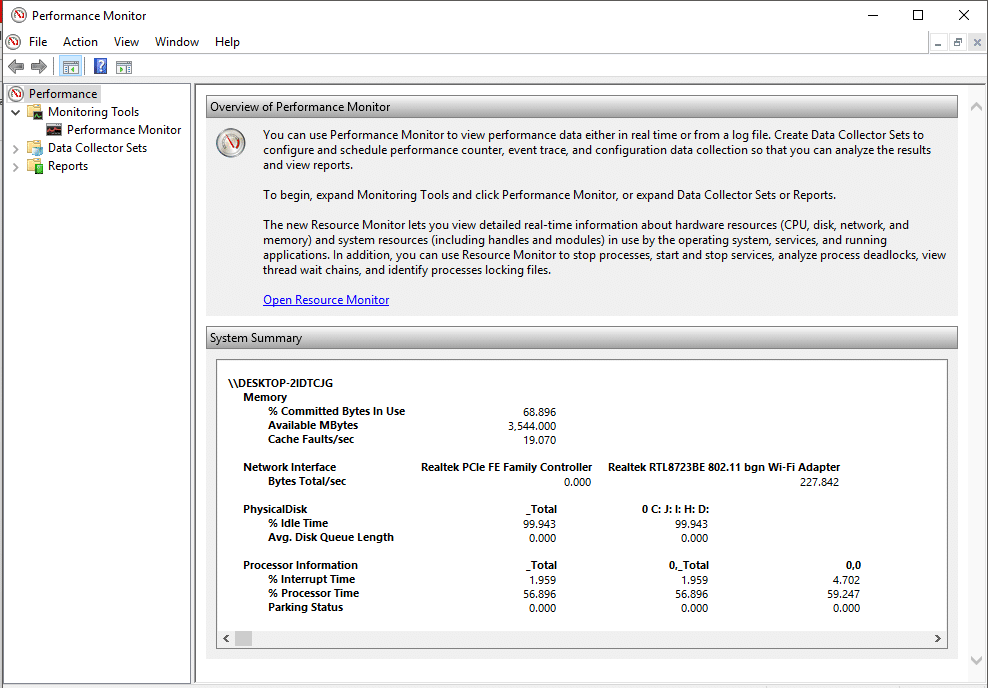
Now, from the left pane, select ‘Performance Monitor' Dưới 'Công cụ giám sát’. The graph you see here is the processor time over last 100 seconds. The horizontal axis displays time and the vertical axis displays the percentage of time your processor consumes working on the active programs.
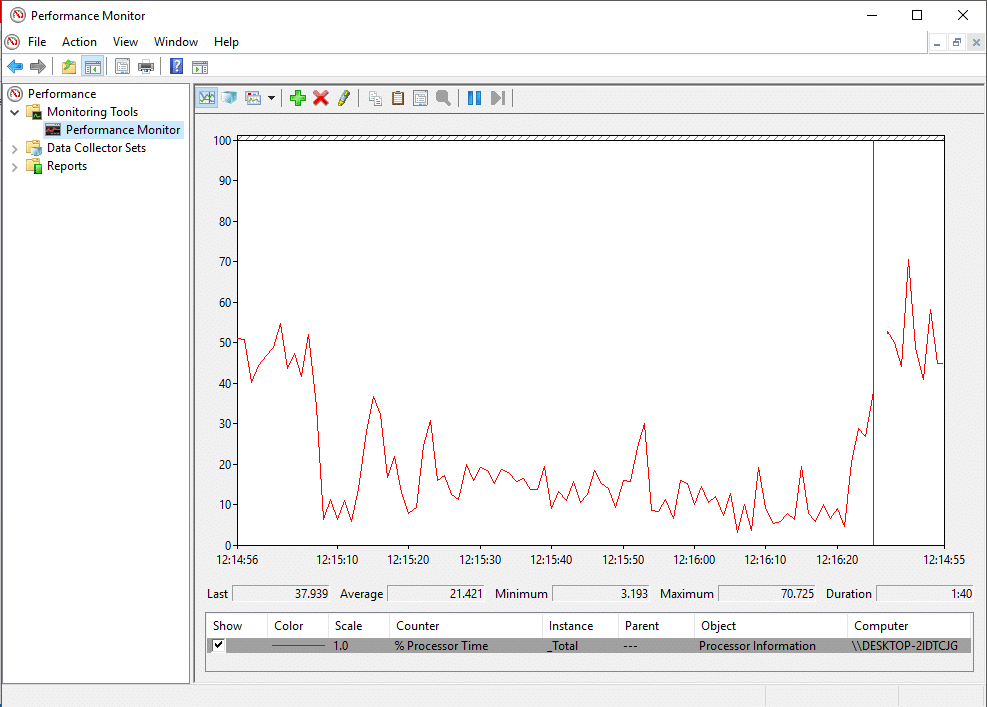
Ngoài ‘Processor Time’ counter, you can also analyze many other counters.
How to add new counters under Performance Monitor
1. nhấp chuột vào green plus shaped icon on top of the graph.
2.The Add Counters window will open.
3.Now, select the name of your computer (usually it is a local computer) in the ‘Select counters from computer’ drop-down menu.
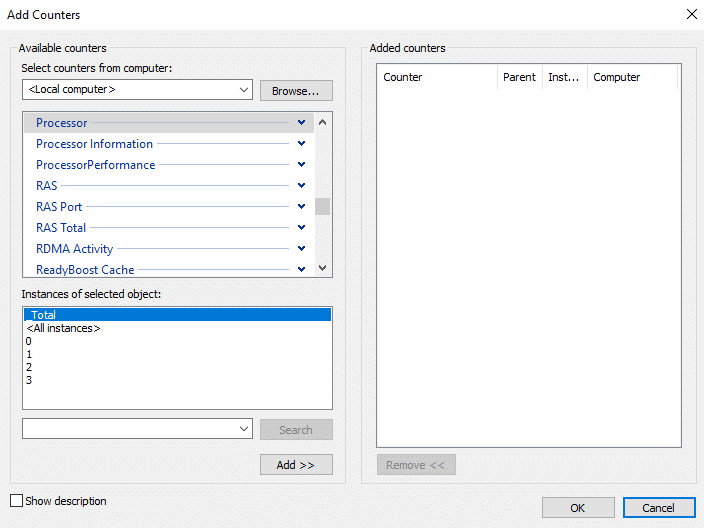
4.Now, expand the category of counters you want, say Bộ xử lý.
5. chọn one or more counters from the list. To add more than one counters, select the first counter, then press down the Phím Ctrl while selecting the counters.
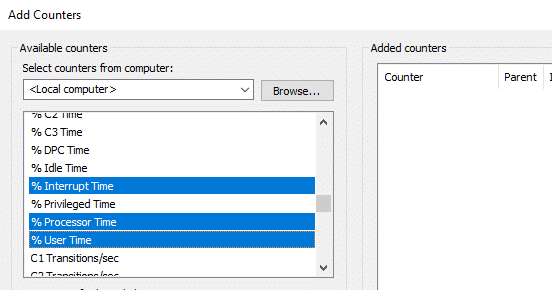
6. chọn instances of the selected object(s) nếu có thể.
7.Click vào Thêm nút to add the counters. The added counters will be shown on the right side.
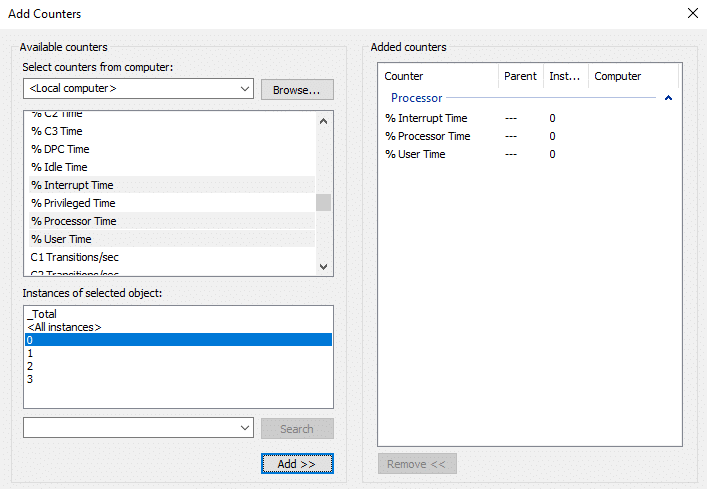
8.Click on OK to confirm.
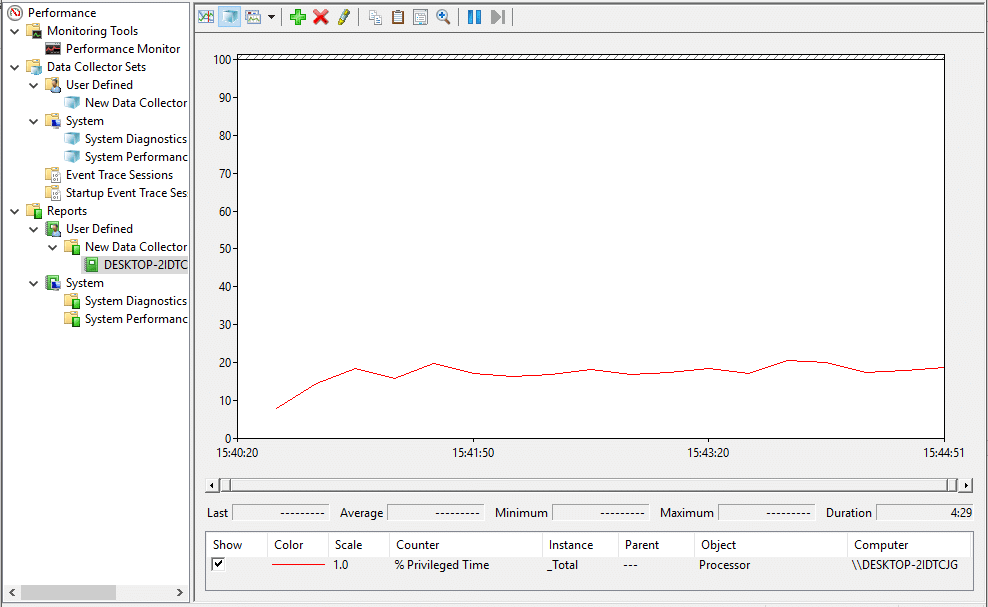
9.You will see that the new counters start xuất hiện trong graph with different colors.
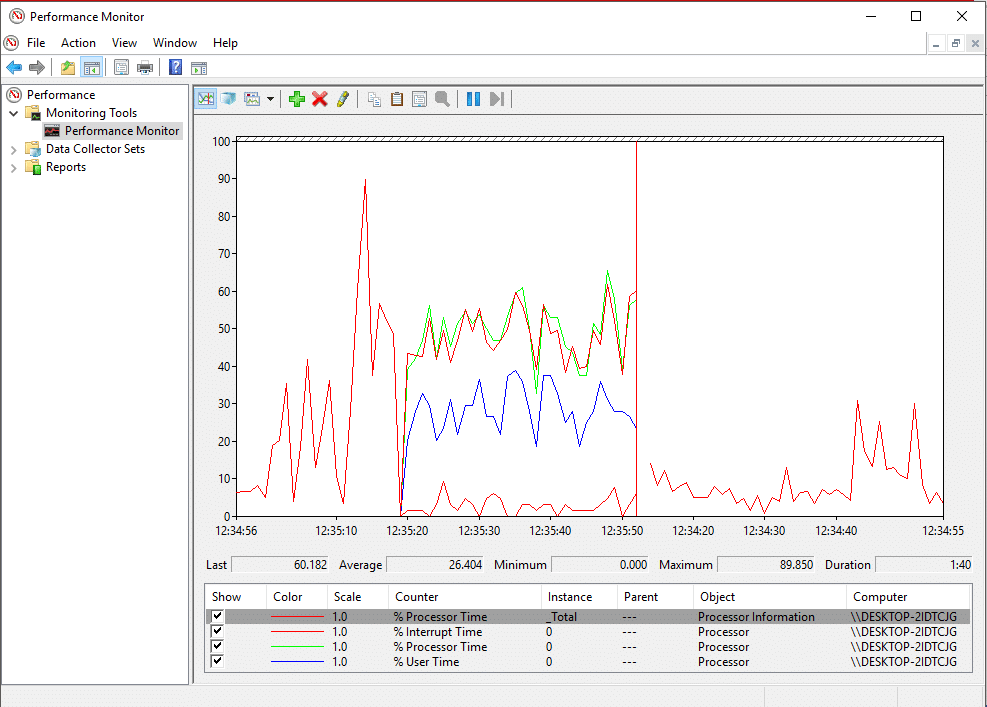
10.The details of each counter will be shown at the bottom, like which colors correspond to it, its scale, instance, object, etc.
11. sử dụng hộp kiểm against each to counter to show or hide it from the graph.
12.You có thể add more counters by following the same steps as given above.
Once you have added all the desired counters, it is time to customize them.
How to Customize the Counter View in Performance Monitor
1.Double-click on any counter below the graph.
2.To select more than one counters, press down Phím Ctrl while selecting the counters. Then nhấp chuột phải và chọn Bất động sản từ danh sách.
3.Performance Monitor Properties window will open, from there switch to the ‘Ngày' chuyển hướng.
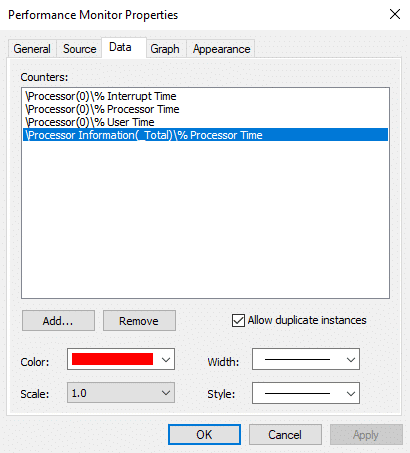
4.Here you can select the color, scale, width, and style of the counter.
5.Click on Apply followed by OK.
An important thing to note here is that when you restart performance monitor, all these set counters and configurations will be lost by default. To save these configurations, nhấp chuột phải trên đồ thị và chọn 'Save settings as’ from the menu.
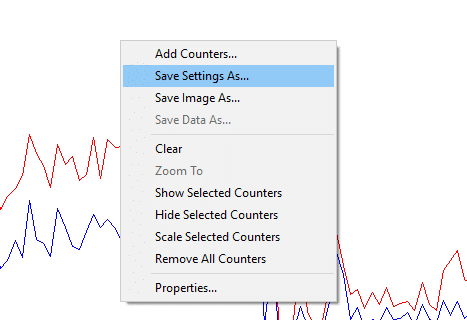
Type the desired file name and click on Save. The file will be saved as a .htm file. Once saved, there are two ways of loading the saved file for later use,
- Right-click on the saved file and select Internet Explorer as the ‘Open with’ program.
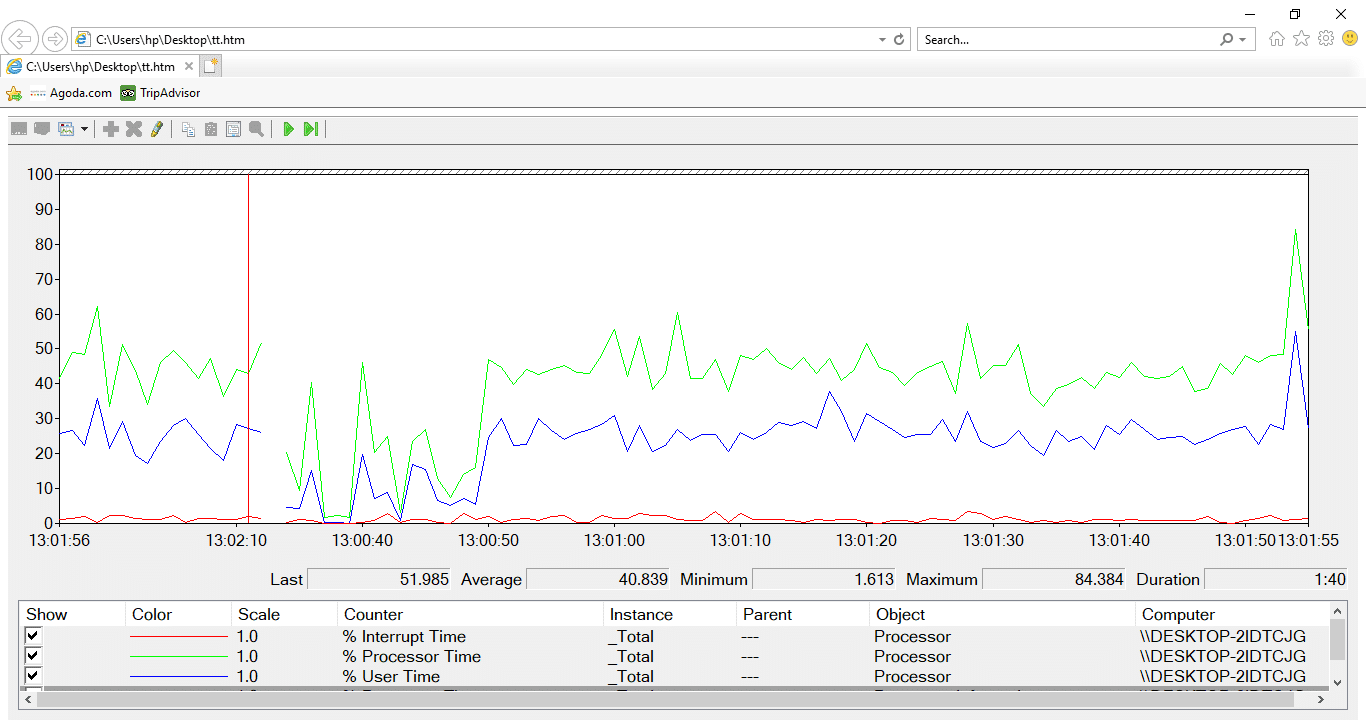
- Bạn sẽ có thể see the performance monitor graph in the internet explorer window.
- If you don’t see the graph already, click on ‘Allow blocked content’ in the popup.
Another way to load it is by pasting counter list. However, this method may not work for some of the users.
- Open the saved file using notepad and copy its contents.
- Now open Performance Monitor by using the steps given before and click on ‘Paste Counter list’ icon on top of the graph.
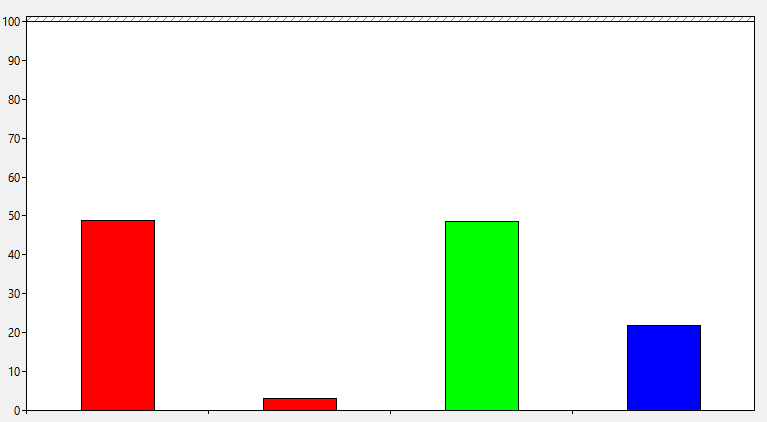
The third icon above the graph is for changing graph type. Click on the downward arrow beside it to select the type of graph. You can choose from line, histogram bar or report. Bạn cũng có thể nhấn CTRL + G to switch between the graph types. The screenshots shown above correspond to the line graph. The histogram bar looks like this:
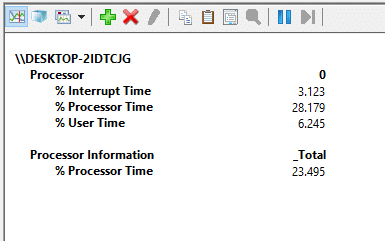
The report will look like this:
Sản phẩm nút tạm dừng on the toolbar will allow you to freeze the constantly changing graph at any instance, if you want to analyze it. You can resume by clicking on the nút phát.
Some Common Performance Counters
Bộ xử lý:
- % Processor Time: This is the percentage of time spent by the processor in executing a non-idle thread. If this percentage stays over 80% constantly, it means it is difficult for your processor to handle all the processes.
- % Interrupt Time: This is the time required by your processor to receive and service hardware requests or interrupts. If this time exceeds 30%, there might be some hardware related risk.
Bộ nhớ:
- % Committed Bytes In Use: This counter shows what percentage of your RAM is currently in use or is committed. This counter should fluctuate values as different programs are opened and closed. But if it keeps on increasing, there might be a memory leak.
- Available Bytes: This counter depicts the amount of physical memory (in Bytes) that are available for immediately allocating it to a process or system. A less than 5% of available bytes means you have very less memory free and may need to add more memory.
- Cache Bytes: This counter tracks the part of system cache which is currently active in physical memory.
Paging File:
- % Usage: This counter tells the percentage of current pagefile in use. It should not be higher than 10%.
PhysicalDisk:
- % Disk Time: This counter monitors the time taken by a drive to process read and write requests. This should not be too high.
- Disk Read Bytes/sec: This counter maps the rate at which bytes are transferred from the disk during the read operations.
- Disk Write Bytes/sec: This counter maps the rate at which bytes are transferred to the disk during write operations.
Giao diện mạng:
- Bytes Received/sec: It represents the rate of bytes being received over each network adapter.
- Bytes Sent/sec: It represents the rate of bytes being sent over each network adapter.
- Bytes Total/sec: It includes both Bytes Received and Bytes Sent.
If this percentage lies between 40%-65%, you should be cautious. For over 65%, the performance will be adversely affected.
chủ đề:
- % Processor Time: It tracks the amount of processor’s effort which is used by an individual thread.
For more information, you can go to the Trang web của Microsoft.
How to Create a Data Collector Sets
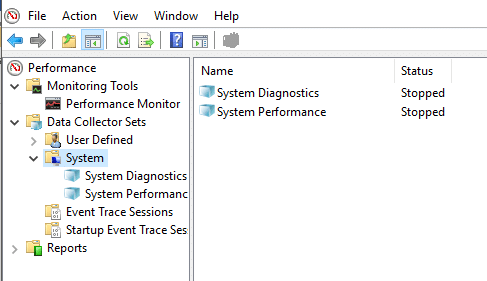
A data collector set is a combination of one or more performance counters which can be saved to collect data over a period of time or on demand. These are especially useful when you want to monitor a component of your system over a specified time period, for instance, every month. There are two predefined sets available,
Chẩn đoán hệ thống: This data collector set can be used troubleshooting issues related to driver failures, faulty hardware, etc. It includes data collected from System Performance along with other detailed system information.
Hiệu suất hệ thống: This data collector set can be used to handle performance related issues like a slow computer. It collects data related to memory, processor, disk, network performance, etc.
To access these, expand ‘Bộ thu thập dữ liệu’ in the left pane on Performance Monitor window and click on Hệ thống.
To Create a Custom Data Collector Set in Performance Monitor,
1.Expand ‘Bộ thu thập dữ liệu’ in the left pane on Performance Monitor window.
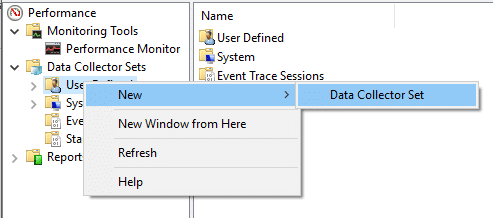
2.Right-click on ‘Đã xác định người dùng’ then select Mới và nhấp vào 'Data Collector Set'.
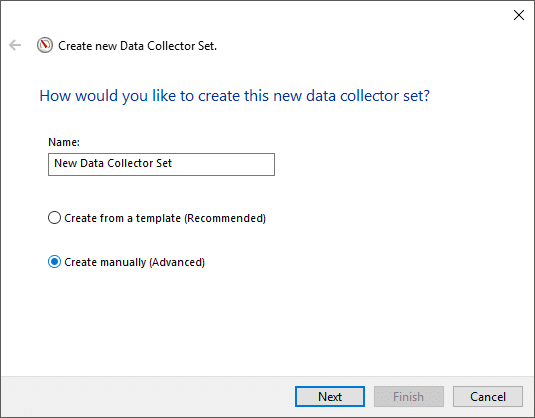
3.Type a name for the set and select ‘Create manually (Advanced)’ and click on Tiếp theo.
4.Select ‘Create data logs’ option and kiểm tra the ‘Bộ đếm hiệu suất’ checkbox.
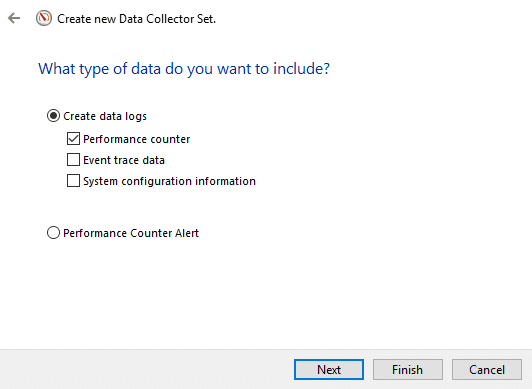
5.Click Sau sau đó bấm vào Thêm.
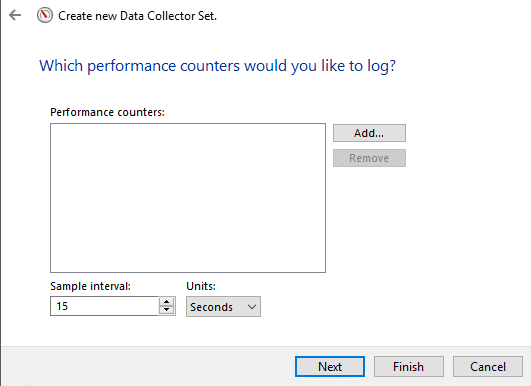
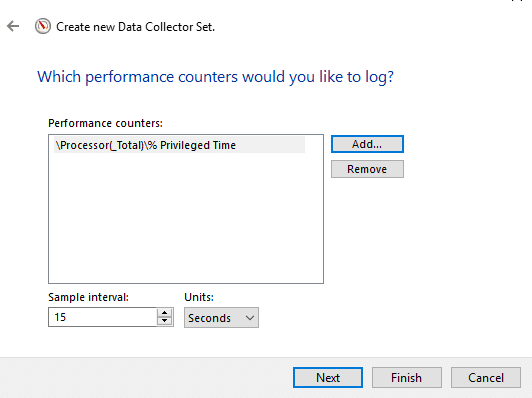
6. chọn one or more counters you want then click on Thêm và sau đó nhấp vào OK.
7.Set the sample interval, to decide when the Performance Monitor takes samples or collects data and click on Tiếp theo.
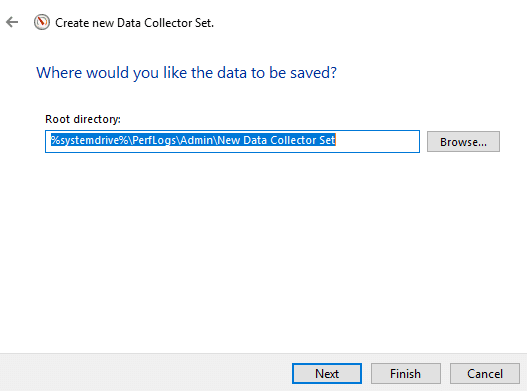
8.Set the location where you want it to be saved và click vào Tiếp theo.
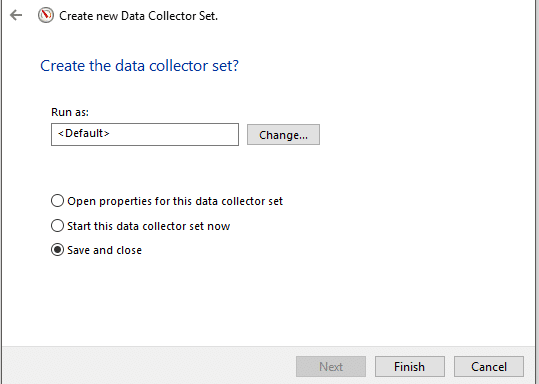
9.Select a specific user you want or keep it default.
10.Chọn 'Lưu và Đóng’ option and click on Kết thúc.
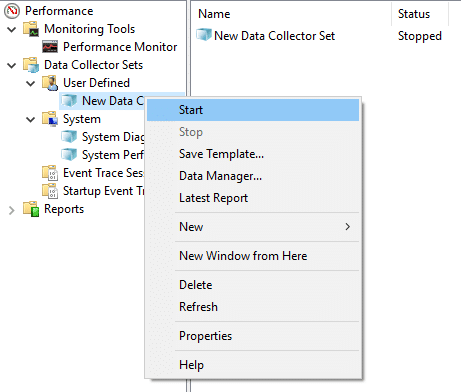
This set will available in the User Defined section of the Data Collector Sets.
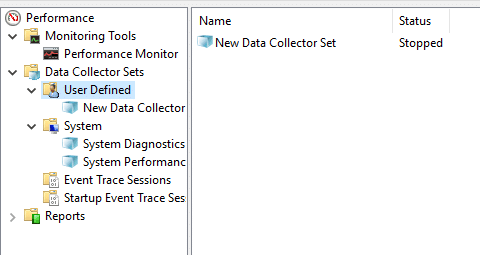
Nhấp chuột phải vào định và chọn Bắt đầu để bắt đầu nó.
To customize the run duration for your data collector set,
1.Right-click on your data collector set and select Tính chất.
2.Switch to ‘Điều kiện dừng’ tab and check the ‘Overall duration’ checkbox.
3.Type the time duration for which you want Performance Monitor to run.
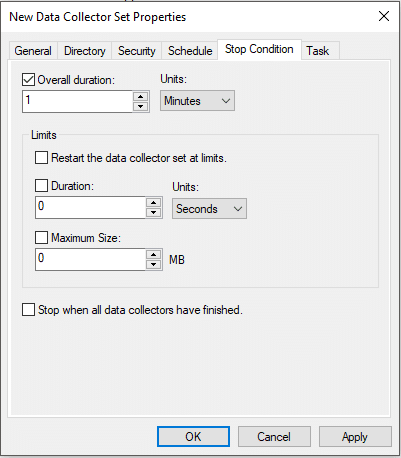
4.Set other configurations then click on Apply followed by OK.
To schedule the set to run automatically,
1.Right-click on your data collector set and select Tính chất.
2.Switch to ‘Schedule’ tab then click on Add.
3.Đặt lịch trình you want then click on OK.
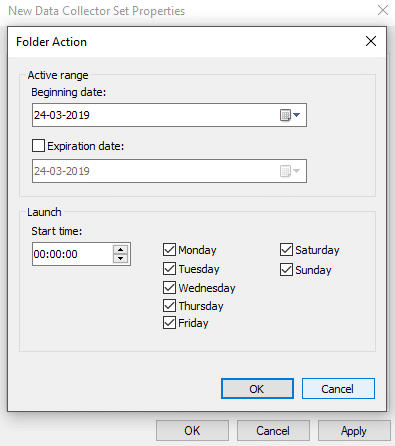
4.Click on Apply and then click on OK.
How to Use Reports to Analyse Collected Data
You can use reports to analyze the data collected. You can open reports for both predefined data collector sets and your custom sets. To open system reports,
- Mở rộng 'Báo cáo’ from the left pane of the Performance Monitor window.
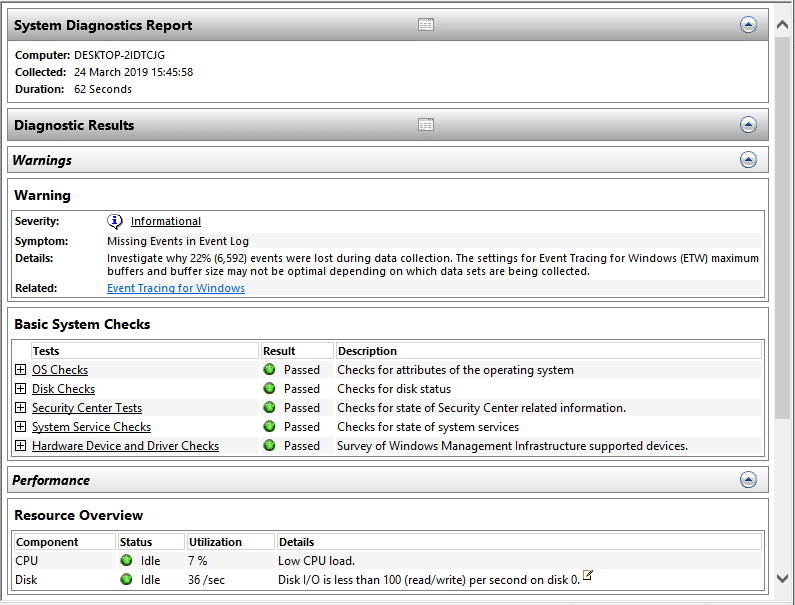
- Nhấp vào WELFARE sau đó bấm vào System Diagnostics or System Performance to open the report.
- You will be able to see the data and results organized and structured into tables that you can use to quickly identify problems.
To open a custom report,
- Mở rộng 'Báo cáo’ from the left pane of the Performance Monitor window.
- Nhấp vào Đã xác định người dùng then click on your custom report.
- Ở đây bạn sẽ thấy recorded data directly instead of results and structured data.
Using Performance Monitor, you can carry out the analysis for almost every part of your system easily.
Đề nghị:
Tôi hy vọng bài viết này hữu ích và bây giờ bạn có thể dễ dàng Use Performance Monitor on Windows 10, nhưng nếu bạn vẫn có bất kỳ câu hỏi nào liên quan đến hướng dẫn này thì vui lòng hỏi họ trong phần bình luận.


)