If your PC has recently crashed, you must have faced the Blue Screen of Death (BSOD), which lists the crash’s cause and then the PC shutdown abruptly. Now the BSOD screen is only shown for a few seconds, and it’s not possible to analyze the reason for the crash at that moment. Thankfully, when Windows crashes, a crash dump file (.dmp) or memory dump is created to save information about the crash just before the Windows shutdown.
As soon as the BSOD screen is displayed, Windows dumps the information about the crash from the memory to a small file called “MiniDump” which is generally saved in the Windows folder. And this .dmp files can help you troubleshoot the cause of the error, but you need to analyze the dump file. This is where it gets tricky, and Windows doesn’t use any pre-installed tool to analyze this memory dump file.
Now there is a various tool which can help you debug the .dmp file, but we are going to talk about two tools which are BlueScreenView and Windows Debugger tools. The BlueScreenView can analyze what went wrong with the PC quickly, and the Windows Debugger tool can be used to get more advanced information. So without wasting any time let’s see How to Read Memory Dump Files in Windows 10 with the help of the below-listed guide.
How to Read Memory Dump Files in Windows 10
Make sure to create a restore point just in case something goes wrong.
Method 1: Analyze Memory Dump Files using BlueScreenView
1. From NirSoft Website downloads the latest version of BlueScreenView according to your version of Windows.
2. Extract the zip file you download and then double-click on BlueScreenView.exe to run the application.
3. The program will automatically search for the MiniDump files at the default location, which is C:WindowsMinidump.
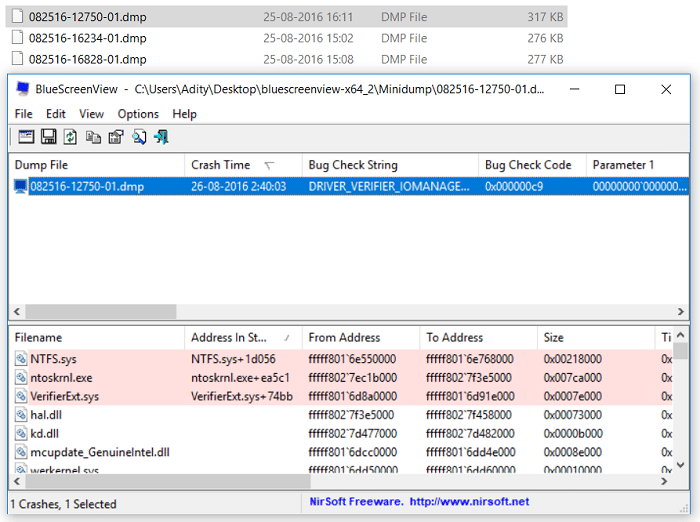
4. Now if you want to analyze a particular .dmp file, drag and drop that file to BlueScreenView application and the program will easily read the minidump file.
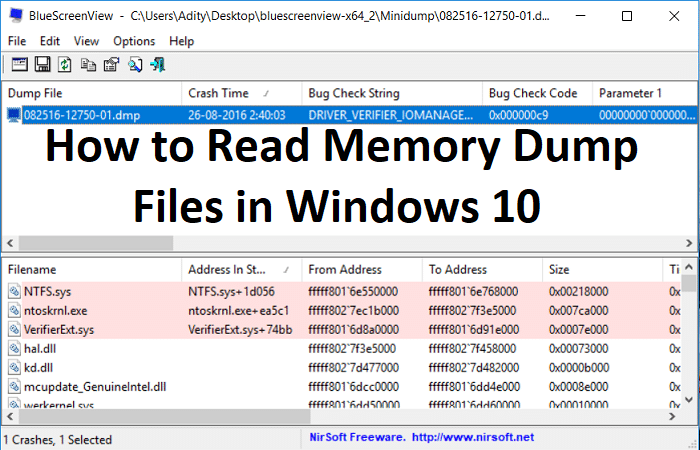
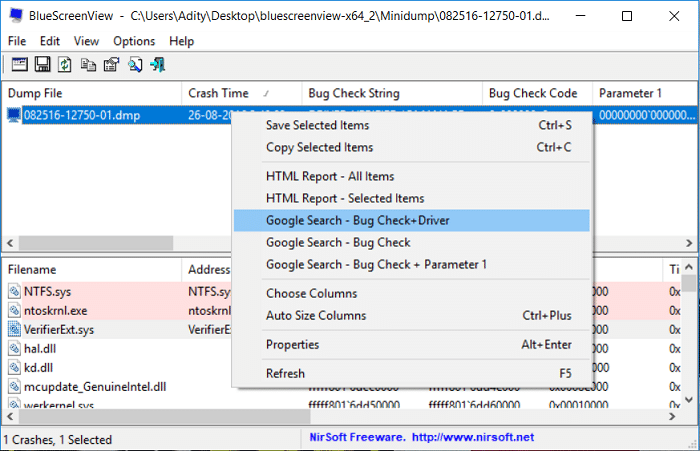
5. You will see the following information at the top of the BlueScreenView:
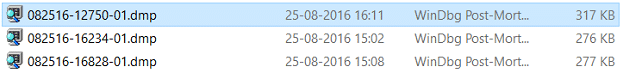
- The name of the Minidump file: 082516-12750-01.dmp. Here 08 is the month, 25 is the date, and 16 is the year of the dump file.
- Crash Time is when the crash happens: 26-08-2016 02:40:03
- Bug Check String is the error code: DRIVER_VERIFIER_IOMANAGER_VIOLATION
- Bug Check Code is the STOP error: 0x000000c9
- Then there will be Bug Check Code Parameters
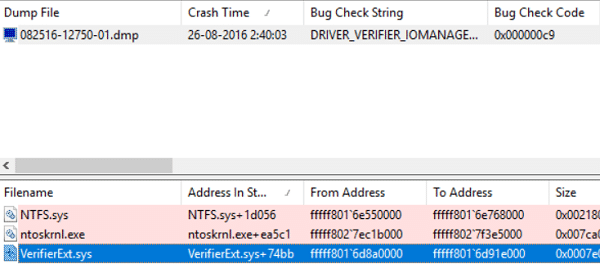
- The most important section is Caused By Driver: VerifierExt.sys
6. In the lower part of the screen, the driver who caused the error will be highlighted.
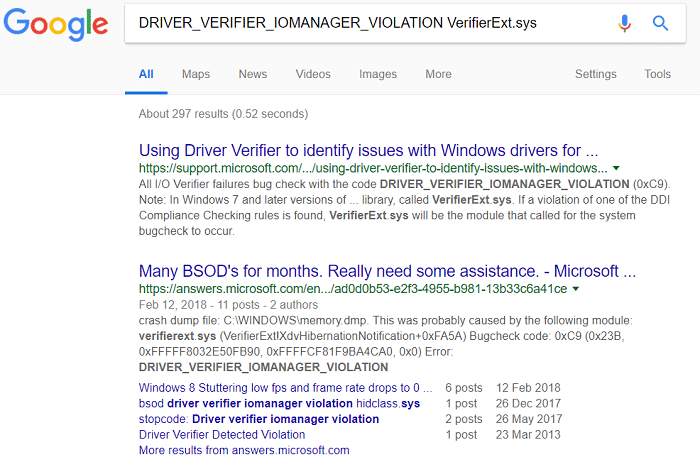
7. Now you have all the information about the error you could easily search the web for the following:
Bug Check String + Caused by Driver, e.g., DRIVER_VERIFIER_IOMANAGER_VIOLATION VerifierExt.sys
Bug Check String + Bug Check Code eg: DRIVER_VERIFIER_IOMANAGER_VIOLATION 0x000000c9
8. Or you can right-click on the minidump file inside the BlueScreenView and click “Google Search – Bug Check + Driver“.
9. Use this information to troubleshoot the cause and fix the error. And this is the end of the guide How to Read Memory Dump Files in Windows 10 using BlueScreenView.
Method 2: Analyze Memory Dump Files Using Windows Debugger
1. Download Windows 10 SDK from here.
Note: This program contains WinDBG program that we will be using to analyze the .dmp files.
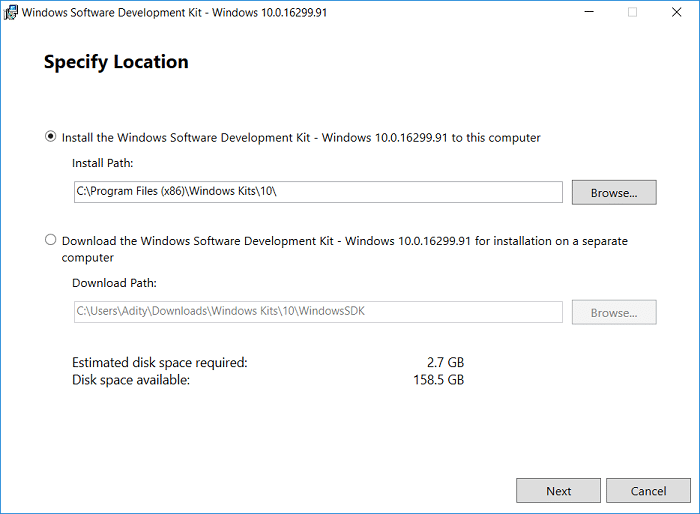
2. Run the sdksetup.exe file and specify the installation location or use default.
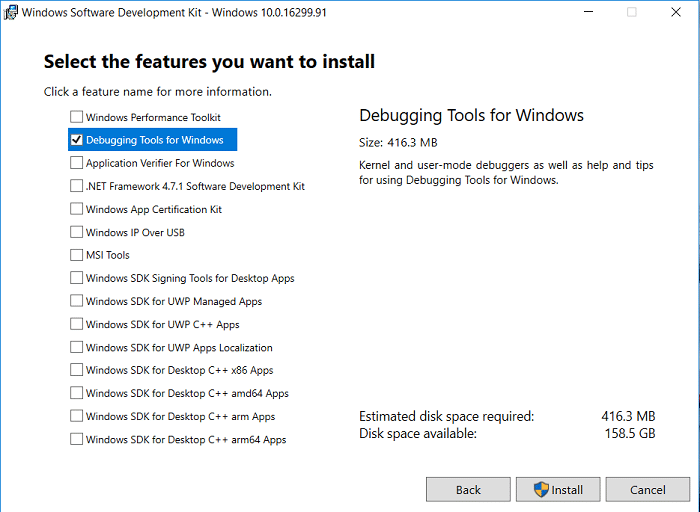
3. Accept License agreement then at “Select the features you want to install” screen select only the Debugging Tools for Windows option and then click Install.
4. The application will begin downloading the WinDBG program, so wait for it to be installed on your system.
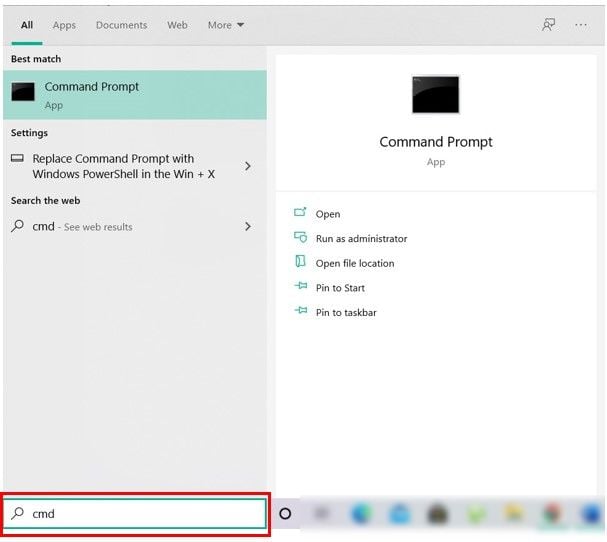
5. Open Command Prompt. The user can perform this step by searching for ‘cmd’ and then press Enter.
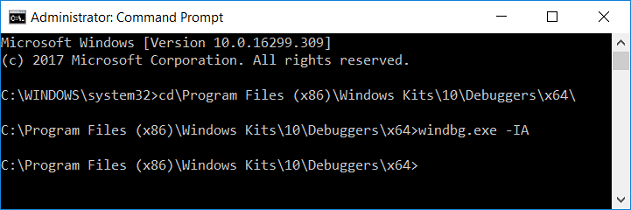
6. Type the following command into cmd and hit Enter:
cdProgram Files (x86)Windows Kits10Debuggersx64
Note: Specify the correct installation of the WinDBG program.
7. Now once you’re inside the correct directory type the following command to associate WinDBG with .dmp files:
windbg.exe -IA
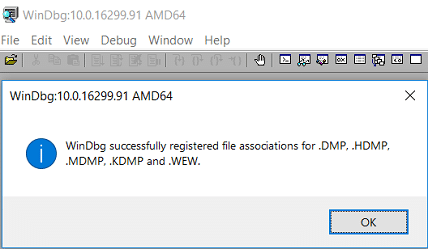
8. As soon as you enter the above command, a new blank instance of WinDBG will open with a confirmation notice which you can close.
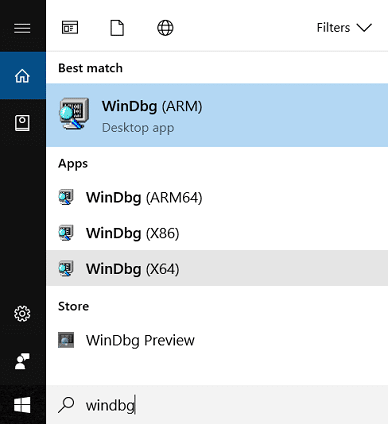
9. Type windbg in Windows Search then click on WinDbg (X64).
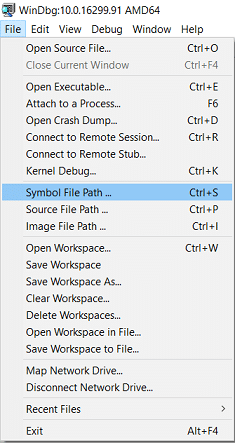
10. In the WinDBG panel, click on File, then select Symbol File Path.
11. Copy and paste the following address into the Symbol Search Path box:
SRV*C:SymCache*http://msdl.microsoft.com/download/symbols
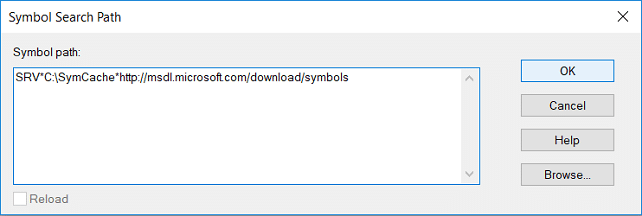
12. Click OK and then save the symbol path by clicking File > Save Workspace.
13. Now find the dump file you want to analyze, you could either use the MiniDump file found in C:WindowsMinidump or use the Memory dump file found in C:WindowsMEMORY.DMP.
14. Double click the .dmp file and the WinDBG should launch and begin processing the file.
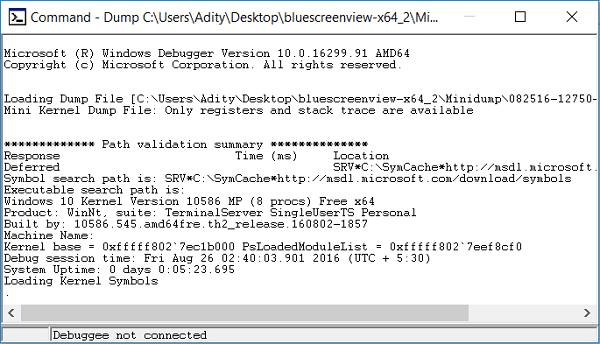
Note: Since this is the first .dmp file being read on your system, WinDBG appears to be slow but do not interrupt the process as these processes are being carried out in the background:
A folder called Symcache is being created in C:
Symbols are being downloaded and saved to C:Symcache
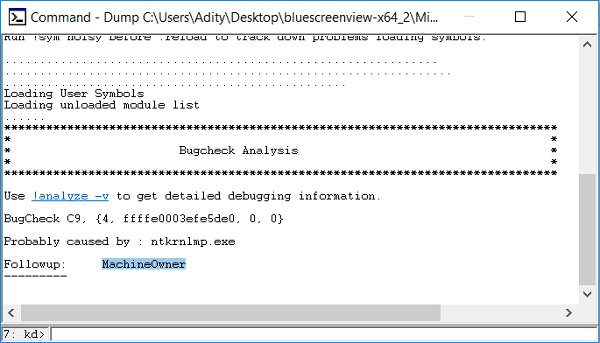
Once the symbols have been downloaded, and the dump is ready to analyze, you will see the message Followup: MachineOwner at the dump text’s bottom.
15. Also, the next .dmp file is processed, it will be quicker as it will have already downloaded the required symbols. Over time the C:Symcache folder will grow in size as more symbols are added.
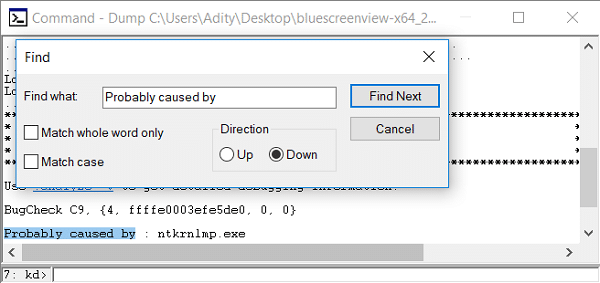
16. Press Ctrl + F to open Find then type “Probably caused by” (without quotes) and hit Enter. This is the quickest way to find what caused the crash.
17. Above the Probably caused by line, you will see a BugCheck code, e.g., 0x9F. Use this code and visit Microsoft Bug Check Code Reference for verifying the bug check refer.
Recommended:
That’s it you have successfully learned How to Read Memory Dump Files in Windows 10 but if you still have any queries regarding this post then feel free to ask them in the comment’s section.