The arrival of Google docs into the world of text editing, which was previously dominated by Microsoft, was a welcome change. Although Google Docs has made quite an impression with its free service and functionality, there are still a few features taken for granted in Microsoft Word but remain largely elusive in Google Docs. One such feature is the ability to easily create graphs and charts. If you find yourself struggling to input statistical data into your document, here’s a guide to help you figure out how to create a graph in a Google Doc.
How to Create a Graph in Google Doc
Google Docs is a free service and is relatively new; therefore, it is unfair to expect it to have the same features as Microsoft Word. While the latter gives users the ability to directly add charts and create graphs in SmartArt, the feature works slightly differently in its Google counterpart. With just a few extra steps, you can make a graph in Google Doc and present data the way you want to.
Method 1: Add Graphs in Google Docs through Spreadsheets
Google services have the habit of working in sync with each other, relying on the features of one app to aid another. In adding graphs and sheets in Google Docs, the services of Google Sheets are heavily employed. Here’s how you can make a chart in Google Docs using the spreadsheet feature provided by Google.
1. Head onto the Google Docs website and create a New Document.
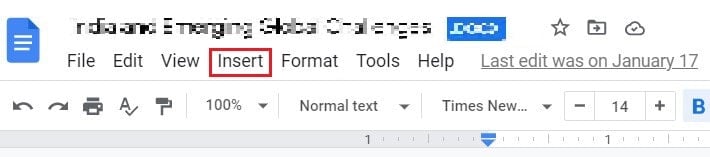
2. On the top panel of the doc, click on the Insert.
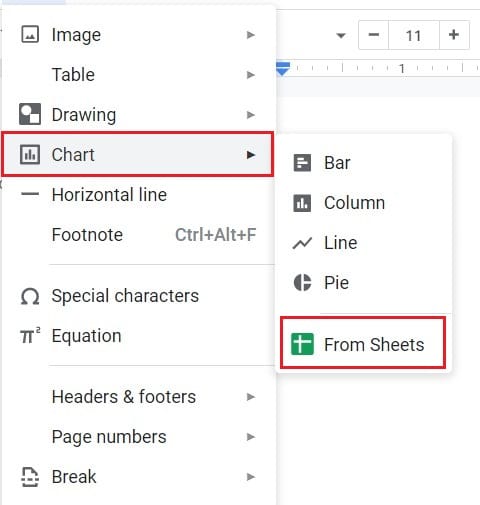
3. Drag your cursor over to the option titled ‘Charts’ and then select ‘From Sheets.’
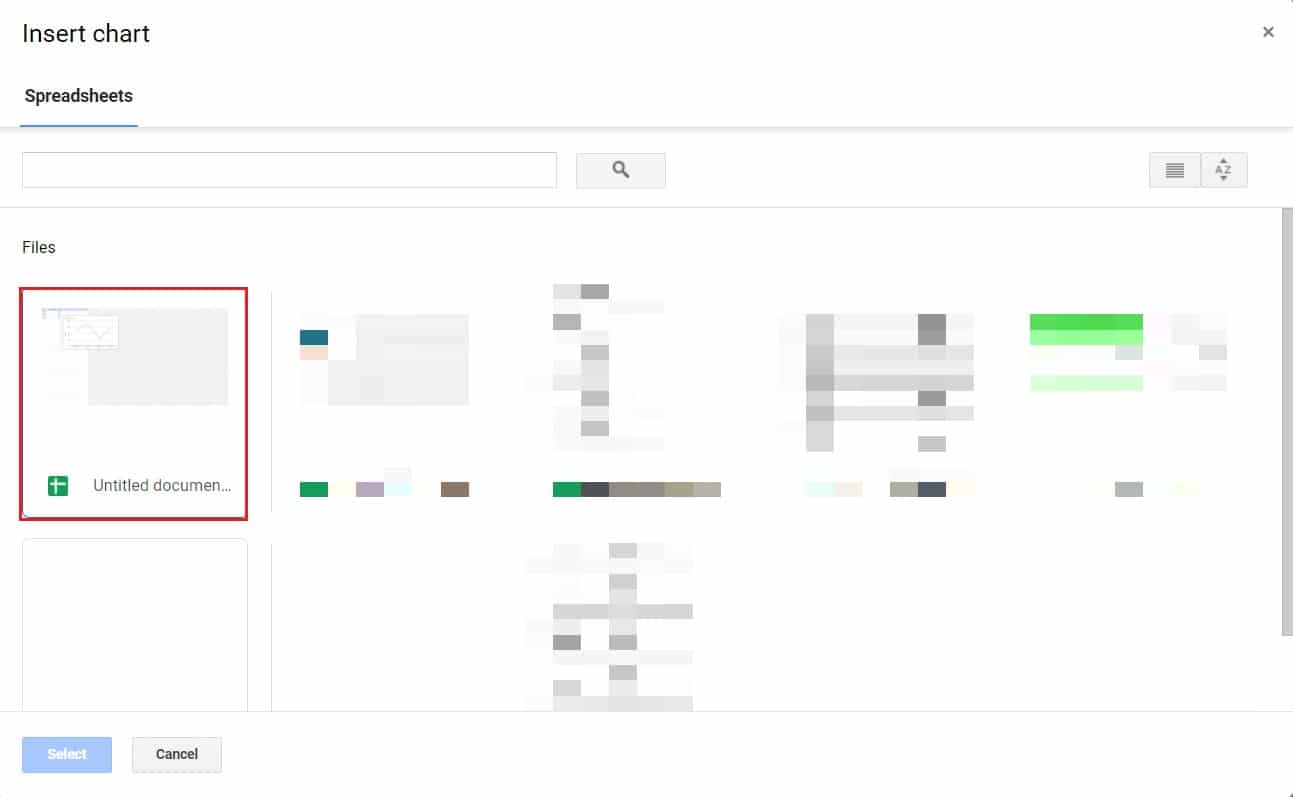
4. A new window will open, displaying all your Google Sheet documents.
5. If you already have a spreadsheet containing the data you want in graph form, select that sheet. If not, click on the first Google sheet that has the same name as your doc.
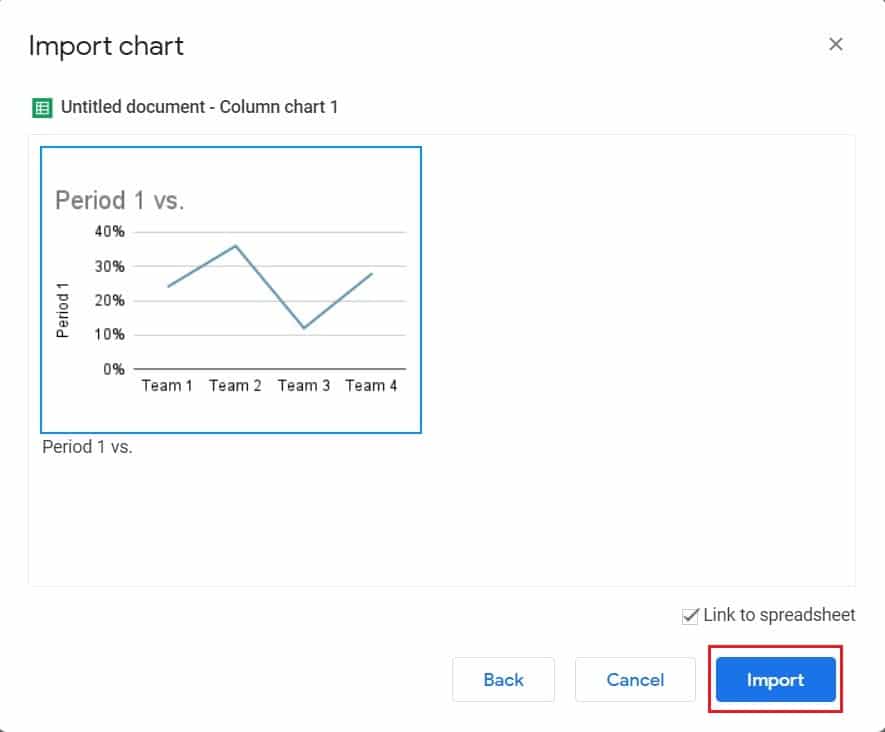
6. A default chart will be shown on your screen. Select the chart and click on ‘Import.’ Also, make sure that the ‘Link to spreadsheet option’ is enabled.
7. Alternatively, you can directly import a graph of your choice from the Import menu. Click on Insert > Charts > the chart of your choice. As mentioned above, a default chart will appear on your screen.
8. On the top right corner of the chart, click on the ‘link’ icon and then click on ‘Open source.’
![]()
9. You will be redirected to a Google sheets document containing a few tables of data along with the graph.
10. You can alter the data in the spreadsheet, and the graphs will change automatically.
11. Once you have entered the desired data, you can begin customizing the graph to make it look more appealing.
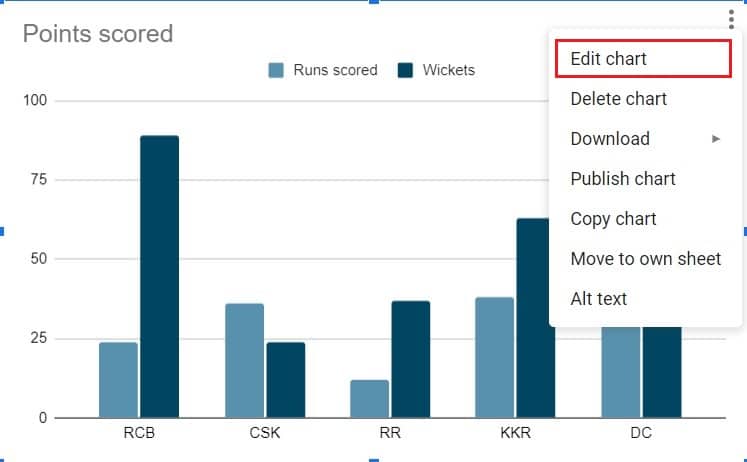
12. Click on the three dots on the top right corner of the chart, and from the list of options, select ‘Edit chart.’
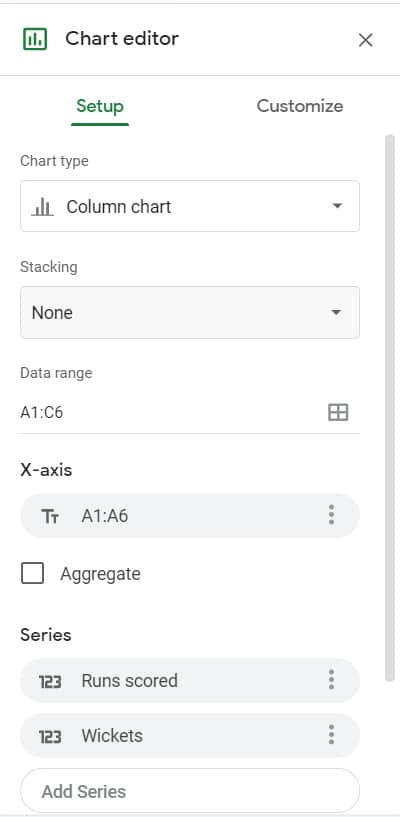
13. In the ‘Chart editor’ window, you will have the option of updating the setup of the chart and customize its look and feel.
14. Within the setup column, you can change the chart type and choose from a wide range of options provided by Google. You can also alter the stacking and adjust the positioning of the x and y-axis.
15. Over at the ‘Customize’ window, you can adjust the color, the thickness, the border, and the entire style of your chart. You can even give your graph a 3D makeover and change its entire look and feel.
16. Once you are pleased with your graph, return to your Google Doc and find the chart you created. In the top right corner of the chart, click on ‘Update.’
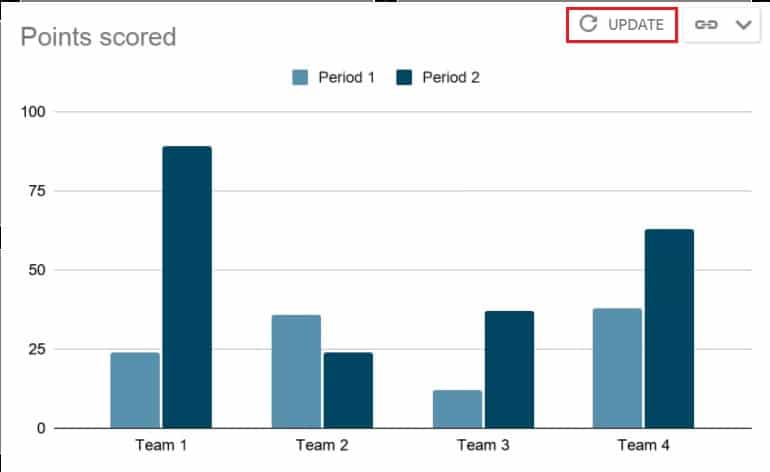
17. Your chart will be updated, giving your document a more professional look. By adjusting the Google Sheets document, you can consistently change the graph without worrying about losing any data.
Method 2: Create a Chart from existing Data
If you already have statistical data on a Google Sheets document, you can directly open it and create a chart. Here’s how to create a chart on Google Docs from an existing Sheets document.
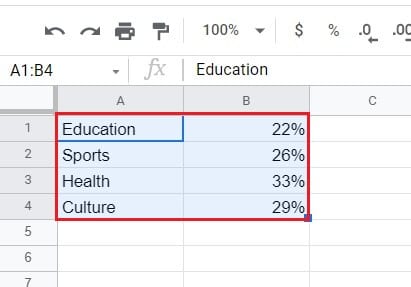
1. Open the Sheets document and drag your cursor over the columns of data you want to convert as a chart.
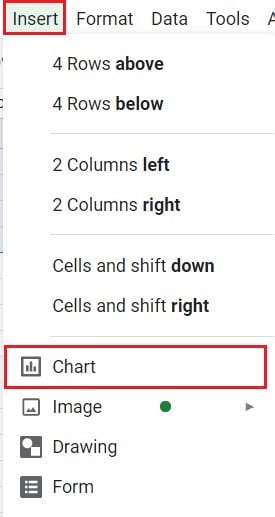
2. On the taskbar, click on ‘Insert’ and then select ‘Chart.’
3. A chart will appear depicting the data in the most suitable graph form. Using the ‘Chart editor’ window as mentioned above, you can edit and customize the chart to suit your needs.
4. Create a new Google Doc and click on Insert > Charts > From Sheets and select the Google Sheets document you just created.
5. The chart will appear on your Google Doc.
Also Read: 2 Ways to Change Margins In Google Docs
Method 3: Make a Chart in Google Doc with Your Smartphone
Creating a Chart through your phone is a slightly more difficult process. While the Sheets application for smartphones supports charts, the Google Docs app is still to catch up. Nevertheless, making a chart in Google Docs through your phone is not impossible.
1. Download the Google Sheets and Google Docs applications from the Play Store or the App Store.
2. Run the Google Sheets app and open the Spreadsheet containing the data. You can also create a new Sheets document and manually insert the numbers.
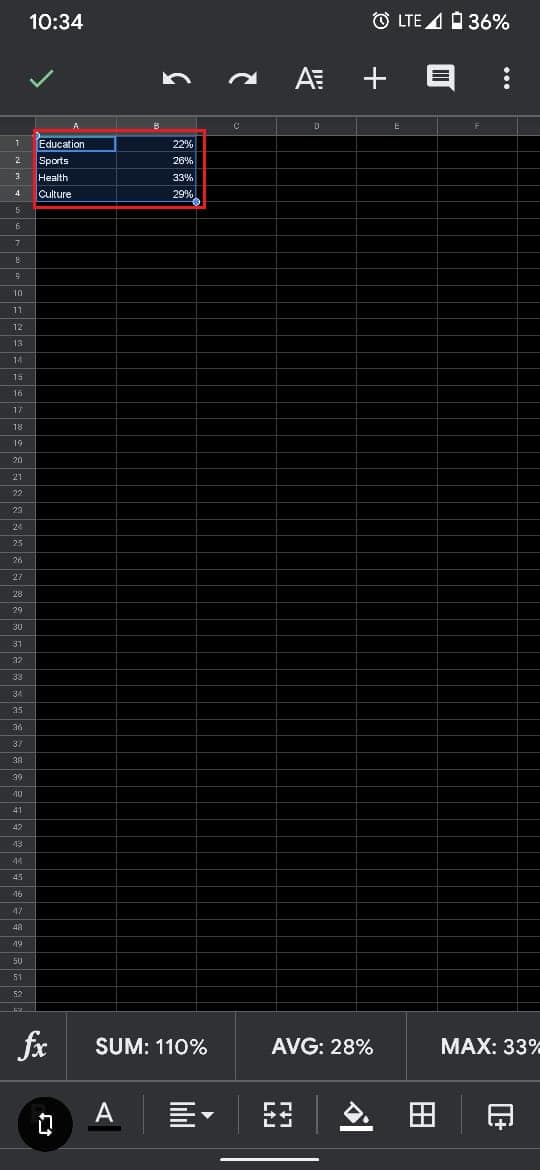
3. Once the data has been input, select one cell in the document and drag then highlight all the cells containing data.
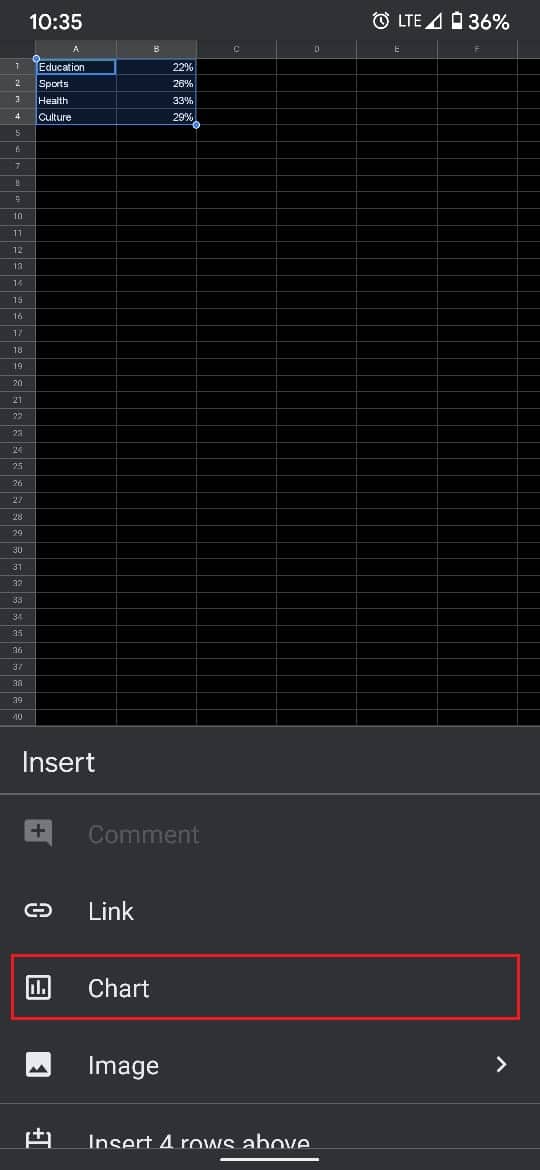
4. Then, on the top right corner of the screen, tap on the Plus icon.
5. From the Insert menu, tap on ‘Chart.’
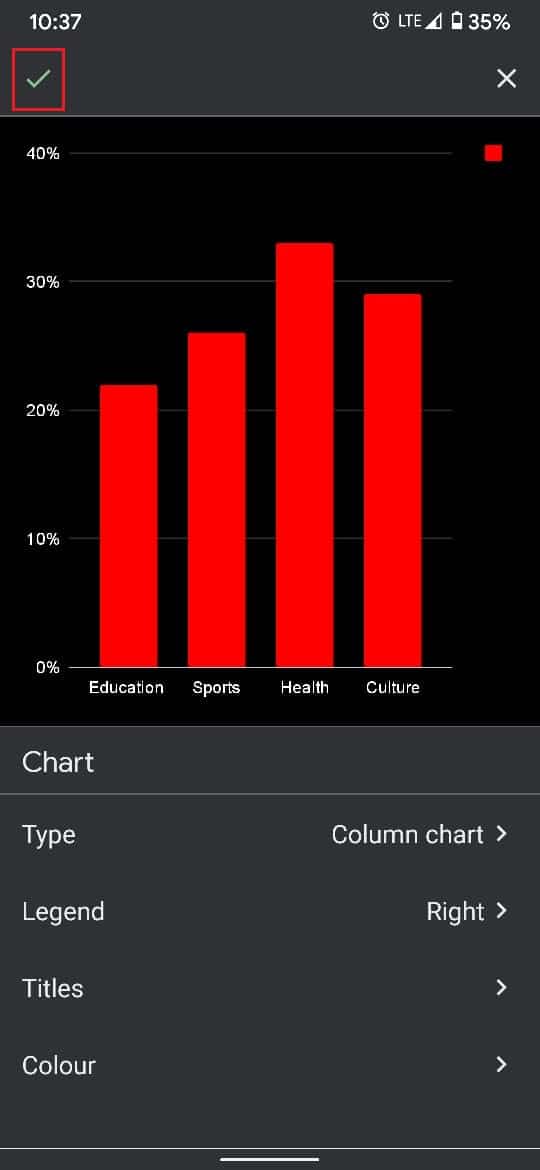
6. A new page will appear, displaying a preview of the chart. Here, you can make a few basic edits to the graph and even change the chart type.
7. Once done, tap on the Tick icon in the top left corner of your screen.
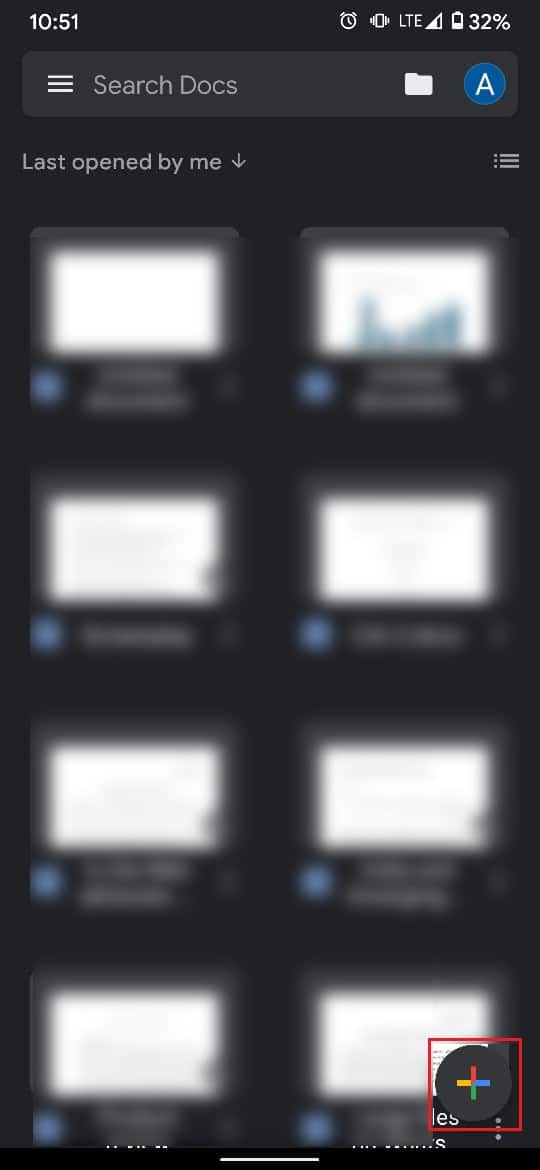
8. Now, open the Google Docs app on your smartphone and create a new document by tapping on the Plus icon in the bottom right corner of the screen.
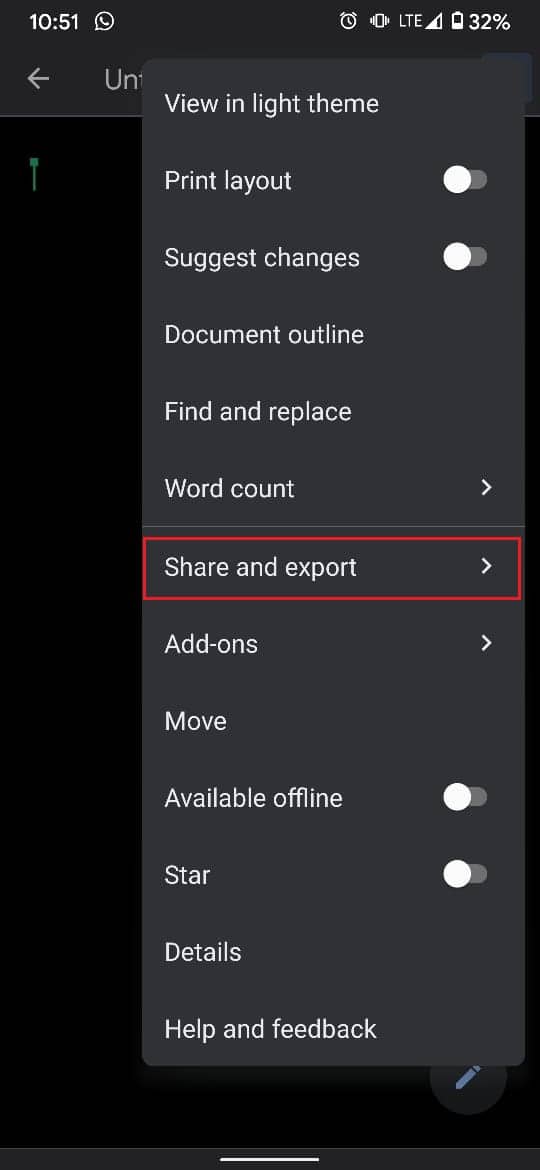
9. In the new document, tap on the three dots on the top right corner of the screen. And then tap on ‘Share and export.’
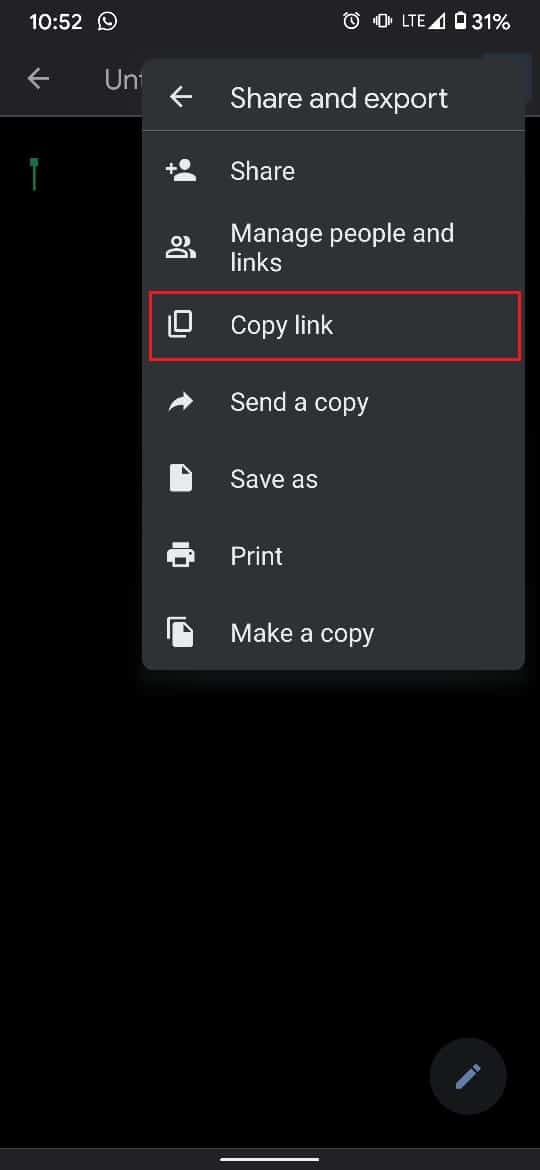
10. From the list of options that appear, select ‘Copy link.’
11. Go ahead and disable the application for a while. This will prevent it from forcefully opening even when you use Docs through your browser.
12. Now, open your browser and paste the link in the URL search bar. You will be redirected to the same document.
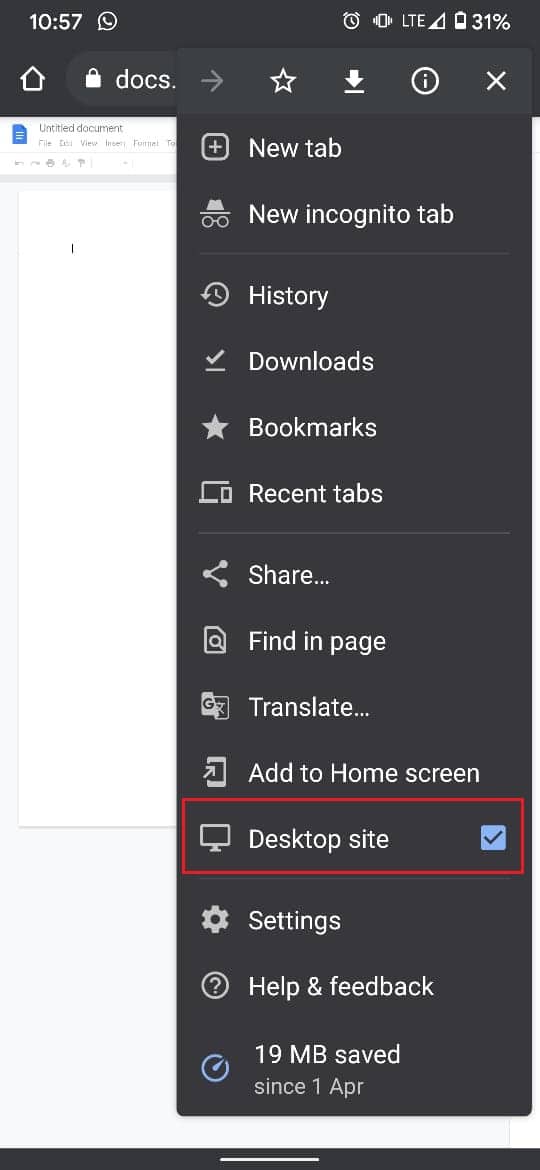
13. In Chrome, click on the three dots on the top right corner and then enable the ‘Desktop site’ checkbox.
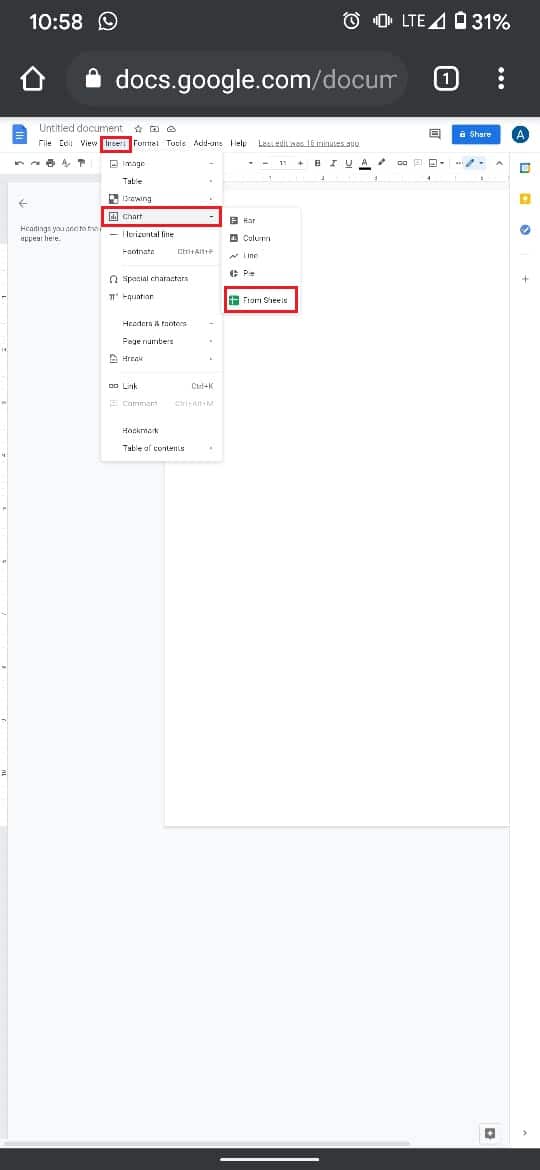
14. The document will open in its original form. Following the steps mentioned above, click on Insert > Chart > From Sheets.
15. Select the excel document you created, and your graph will appear on your Google Doc.
Graphs and charts can come in handy when you want to present data in the most appealing way possible. With the steps mentioned above, you should have mastered the art of crunching numbers in Google-related editing platforms.
Recommended:
We hope that this guide was helpful and you were able to create a graph in Google Docs. Also read How to Create a Hanging Indent in Word and Google Docs.. If you still have any queries regarding this article, then feel free to ask them in the comments section.